
Read all 6 or skip to the section you want to read.
AFFINITY PLUS FCUAMPLIFY CREDIT UNION CENTRA CREDIT UNIONTEACHERS CREDIT UNIONWINGS FINANCIAL CREDIT UNION WORKERS CREDIT UNION
The COVID-19 pandemic has pushed analytics teams out of their cubicles and onto the front lines as they identify for their credit unions which members need help the most and how to deliver it. They are spotting trouble in the fall offs of direct depositsand timely loan payments. They’re also parsing channel usage and branch traffic for actionable insight that decision-makers can use for tactical changes now and strategic planning later.
Here, six accomplished credit union data analysts share what’s happening inside their shops.
Affinity Plus Federal Credit Union
Stephen Geyen has been vice president of business intelligence for the past five years at Affinity Plus Federal Credit Union ($2.4B, St. Paul, MN).
How are you using analytics to serve members during this crisis?

Stephen Geyen, Vice President of Business Intelligence, Affinity Plus FCU
Stephen Geyen: We began to see a significant drop off in member activity on March 16. Within two weeks we created approximately 25 PowerBI visuals that showed the changing member activity on a day-to-day basis. The changes were breathtaking,and seeing them allowed us to quickly ask critical questions about how we should reallocate resources and support our members.
At the employee level, their roles changed when we closed lobbies on March 17. The branch employees who were not working the drive-thru began working remotely, taking member calls, making outbound calls to members, supporting off-the-charts mortgage activity,and helping with inquires to our credit work-out team.
At the member level, we began analyzing changes in activity to identify those who could benefit from immediately working with us versus waiting until they had to throw in the towel.
What are you looking for in the data, and what do you do when you see it?
SG: We began tracking unemployment deposits, skip-a-pay, forbearance requests, loans past due, and changes in revolving debt, and we developed models to identify changes in member income and spending. We use these data points to identifymembers who are feeling financial stress and provide lists to the outbound call teams so they can reach out with an offer of support. We’ve also used these lists to create offers of support via email and digital banking pop-ups.
What results have you seen so far?
SG: We’ve seen significant spikes in use of forbearance, consumer loan skip-a-pay, members calling in for financial support, and clicks on our educational content that we specifically designed for COVID-related issues. Furthermore,member feedback has been positive, and results suggest our NPS score could increase due to the efforts we’re making to proactively work and communicate with our members.
What have you learned about using analytics in this way, either as a best practice or a lesson learned?
SG: The PowerBI visuals span nearly every member channel, product, and service from fee activity to RDC use, loan apps to closing, phone use to card use. That has allowed us to dive deeper based on other factors such as location,channel, platform, and FICO scores.
Amplify Credit Union
Matthew Monagle joined Amplify Credit Union ($994.5M, Austin, TX) as marketing communications manager in March 2019.
How are you using analytics to serve members during this crisis?

Matthew Monagle, Marketing Communications Manager, Amplify Credit Union
Matthew Monagle: When shelter-in-place orders started going into effect around the state of Texas, our loan servicing and account resolutions teams went to work implementing a new deferment program. If our members’ income has beenimpacted by the COVID-19 pandemic, we will help them set up a series of scheduled deferments for personal, business, or real estate loans.
With so many people in our community struggling, this has been an opportunity for us to practice what we preach as a credit union. The challenge, though, has been making our members aware of this option before their loans become delinquent.
What are you looking for in the data, and what do you do when you see it?
MM: The Amplify marketing team crafted an automated email that goes to all members near the end of their late payment graceperiod. Using payment data, we identify which members are at risk of going into a delinquent status and proactively offer them a payment solution. This report also helps highlight at-risk members for our team to follow-up with directly.
What results have you seen so far?
MM: As of the middle of April, we’ve delayed 2,010 months of payments on 1,042 loans for balances totaling approximately $34 million. Just as important, however, is the number of members who are experiencing a hardship who havereached out to discuss loan payment options. Education is a key component of what we do at Amplify, and it’s been gratifying to see members recognize that they do have options during this difficult time.
What have you learned about using analytics in this way, either as a best practice or a lesson learned?
MM: Identify problems before they become problems. We’ve all seen cases where a negative situation might’ve been avoided if a member had an opportunity to make changes to their account. Informing our members of their defermentopportunities before their loans go delinquent protects our finances as well as theirs.
Centra Credit Union
Carrie Jenkins has been assistant vice president of business analytics at Centra Credit Union ($1.6B, Columbus, IN) for the past three years.
How are you using analytics to serve members during this crisis?

Carrie Jenkins, Assistant Vice President of Business Analytics, Centra Credit Union
Carrie Jenkins: My team and I have been providing our decision-makers and front-line staff with real-time information to help them keep a thumb on the pulse of the credit union. The analytics we’ve provided have helped develop reliefprograms and provided insight into the communications members need so we can proactively educate them about these programs.
We have call logs and call reason trending for our contact center, transaction volumes, daily cash withdrawal trends, lending production and pipeline reports, VPN connection volume reports, and information on accounts that are delinquent but do not havea history of delinquency.
What are you looking for in the data, and what do you do when you see it?
CJ: I haven’t been monitoring much of this myself; however, my team and I always look for opportunities to help decision-makers implement new programs or changes to meet members’ needs, improve the member experience, and promotebusiness continuity.
What results have you seen so far?
CJ: I’ve received positive feedback about the information my team provides. Knowledge really is power. No one is operating on a hunch or a guess.
What have you learned about using analytics in this way, either as a best practice or a lesson learned?
CJ: Just because the information is presented in a chart does not mean it’s easy to understand. At times, it seems like people are looking at a Rorschach test and not a bar chart. Everyone has their own opinion about what the chartreally means. This type of summarized information needs a clear explanation of the source, the results, and the key takeaway. I find myself explaining things like why a decrease in the rate of increase is not just a decrease. As storytellers, we havethe responsibility to make sure what we say cannot be misconstrued.
Teachers Credit Union
Mike Benassi has been with Teachers Credit Union ($3.3B, South Bend, IN) for 17 years and in his current role for the past two-and-a-half years.
How are you using analytics to serve members during this crisis?

Mike Benassi, Senior Director of Data Insights and Business Transformation, Teachers Credit Union
Mike Benassi: We look at eight weeks of members’ direct deposit history in two-week buckets to spot deviations outside the norm. If a member normally gets $3,000 every two weeks in direct deposits but now is getting only $1,000,that’s a significant reduction in income.
What are you looking for in the data, and what do you do when you see it?
MB: We flag outliers and call and ask, Hey, how are things going? and let them know TCU is here to offer assistance. We tell them about loan deferrals and about our skip-a-payment program. It’s a wellness check tohelp support the health and safety of our members in these trying times.
What results have you seen so far?
MB: Our CEO sends daily emails about what he’s hearing from members, and he says a lot of them are grateful to hear from us. TCU members like knowing we have their financial needs in mind and that we’re here to help. We alsoare building dashboards that show some interesting results. For example, skip-a-payment use greatly exceeded our original expectations. In fact, we did more of these transactions from March 15 to April 15, than we did in all of 2018.
What have you learned about using analytics in this way, either as a best practice or a lesson learned?
MB: You can do some pretty easy calculations to really help people in these trying times. It’s not rocket science. We used simple stats from looking at direct deposits, just means and standard deviations, to quickly come up witha good list. You can spend a lot on expensive software and powerful modeling tools, but there are also things you can do inexpensively and easily that can immediately make a real impact.
Wings Financial Credit Union
Mike Lindberg has been with Wings Financial Credit Union ($5.6B, Apple Valley, MN) for the past six years and leading the data solutions team for the past three-and-a-half years.
How are you using analytics to serve members during this crisis?

Mike Lindberg, Vice President of Analytics and Business Consulting Services, Wings Financial Credit Union
Mike Lindberg: The COVID-19 pandemic and subsequent response is unprecedented in the level of impact to society at least in the lifetime of most reading these words. Unprecedented events tend to instill anxieties and fear intothe people facing them. The single most valuable thing Wings is using analytics for is to provide foundational clarity in the details, thus calming some of the emotions we feel.
We’re using data to support a greater understanding of where our members are currently affected. We’re also using data to provide insight and forecasts/predictions into what the next six to 12 months might look like.
Knowing we don’t have much data to base our forecasts and predictions on, we’re working diligently with the business to ensure we capture more data than ever to be able to provide useful information to help them drive their strategy in servingour members most effectively.
What are you looking for in the data, and what do you do when you see it?
ML: We’re helping identify members who might be suffering financial hardship. We’re also helping to understand branch traffic, how we can balance employee health and member service, and how much cash we need to keep on hand.
We’ve seen that stay-at-home orders reduce overall spending, so what is the impact of that? The longer stay-at-home orders remain in effect, the more likely our members’ channel preferences will be affected, so how do we best support the continuedbuild-out of our digital channels?
What results have you seen so far?
ML: We’ve seen the business lean-in to data solutions and leverage analytics to answer ad-hoc questions and enhance business processes that further our ability to make things easier for members.
As an organization, we’ve seen employees and leaders come together to serve our membership in amazing ways. We’ve seen the organization take on complex efforts to truly leverage data in the service of members. Most importantly, we’veseen and are experiencing the credit union difference the ability to unabashedly serve our members during this difficult time.
What have you learned about using analytics in this way, either as a best practice or a lesson learned?
ML: Difficult times might be the best time to ask co-workers, members, friends, family, and those we encounter, How can I serve you? This is an isolating time, and we have the opportunity to feel connected. It’s inthese isolated, difficult times that we remember lessons best.
As a person, I want those around me to receive the lesson that I care. As a co-worker and as a data solutions team, I want the business and membership to know we are here to lift them up. As a credit union movement, I want our members to know, withoutany doubt, that we are here to serve them.
Workers Credit Union
Cassandra Stoddard has been with Workers Credit Union ($1.9B, Fitchburg, MA) since October 2013 and in her current role for four years.
How are you using analytics to serve members during this crisis?

Cassandra Stoddard, Assistant Vice President of Enterprise Analytics, Workers Credit Union
Cassandra Stoddard: The fastest, most effective way to gain a directionally accurate picture of how our membership is being affected in this time of crisis is to look at our transactions. As luck would have it, my team had just finisheda complete overhaul of our transaction data, which includes a bi-monthly check and balance from our warehouse back to core. Data integrity is the pillar of success in driving a data-driven culture, crisis or no crisis.
There have been a handful of existing processes that, working with our member experience team, we have chosen to relax or enhance. That includes identifying members with paper statements and urging them to convert to e-statements as mass mailings canbe delayed, identifying members who will fall out of the level needed for higher interest on their checking accounts, designing a new set of user fields that my team can access and report on, and identifying the members who have been granted severaldeferred loan payments.
We’re also involved with helping to respond to additional regulatory reporting and reforecasting our budget because of pandemic-related changes in cash flow, loan mixes, and more.
What are you looking for in the data, and what do you do when you see it?
CS: Our enterprise analytics team answers questions and delivers analytics that positively impact the financial wellness of our credit union and our members. This is where the rubber meets the road.
As the situation unfolds, we look for guidance from our management teams, making sure the EA team is there to support those that have committed to using data to help solve problems. We look for opportunities to listen to them and help them adjust to fittoday’s circumstances, building on their existing relationship with familiar data.
It’s common for organizations with even the most advanced analytic capabilities to fight the ever-lasting power of gut-feeling decision-making, but when past experience fails you, data doesn’t.
What results have you seen so far?
CS: We have very few metrics so far. We can track transactions and document contact center activity, but we’re still in prevention mode.
The organization is confident the EA team can use data to help our peers respond to changes with agility and accuracy. We’ve had productive meetings where managers are collaborating and coming up with a range of scenarios in which we could findourselves, helping to keep the credit union more stable.
4 Critical Areas Of Analysis
The analytics team at Workers Credit Union has looked at transactions to develop a fast, accurate picture of the COVID-19 pandemic’s effect on the Massachusetts credit union’s 104,210 members.
Cassandra Stoddard, assistant vice president of enterprise analytics, details four areas in which her team has delivered crucial data during the past few weeks:
- Trend Analysis: How are members using the credit union today versus in the past?
- Channel Analysis: How are members communicating with the credit union? How can Workers best use the staff it has to accommodate channels most frequently used by members?
- Shared Branching: Does Workers have members who typically transact with other organizations for convenience? Are these members aware of what the credit union has in place to support their financial needs while respecting social distancing?
- Transaction Fluctuations: Are ACH and external deposits dropping? Has a member stopped making loan payments? Which members are receiving unemployment deposits?
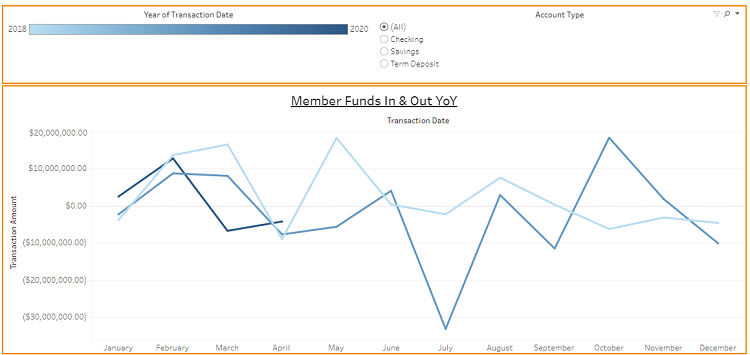
A dashboard at Workers Credit Union shows the flow of member funds, online banking, and employee transactions.
We’ve also noticed urgent data requests are slowing down, which means we’ve done an adequate job of providing a variety of analytics around our most pressing areas of concern.
What have you learned about using analytics in this way, either as a best practice or a lesson learned?
CS: The EA team has focused for years on being able to answer 80% of our questions with 20% of our data. We have built a data environment that houses the main pieces of our core, which some find to be overly defensive in terms of strategybut has resulted in an incredibly high confidence level in the data we have needed to get us through this crisis day by day.
My decision to be conservative has positioned our credit union to deal with emergencies. Our foundation is rock solid. Not to say I don’t look back and consider the benefits of being more innovative in nature and where that would have put us inall of this, but I feel good that we can build upon what we have.
Interviews have been edited and condensed.