
Headlines at the end of 2021 were dominated by inflation that has continued to dog the U.S. economy. COVID-driven supply chain disruptions and a tight labor market have driven up operational costs across the country, forcing businesses to decide if and how to pass rising costs on to consumers.
With rate hikes and balance sheet tapering in the new year, financial institutions are likely to start realizing higher loan yields, but the effect on demand for financing remains to be seen. Central bank reactions to the budding conflict in Eastern Europe, as well as its impact on global trade, also pose earnings headwinds for many industries.
Key Points
- Total credit union net income increased 74.2% from 2020 totals to $21.0 billion. Credit union revenue through Dec. 31 increased 1.8% year-over-year; total expenses declined 9.8% during the same period.
- The average yield on loans was 4.37%, down 33 basis points from one year ago. Investment yields also declined from 1.35% to 0.89% over the same period.
- Total operating expenses expanded 7.4% annually. Growth was mainly driven by compensation expense, which increased 6.7% year-over-year and comprises 52.0% of operating expenses. Reduced interest and provision expenses kept total expenses low.
- Non-interest income increased 12.8% year-over-year to $26.9 billion. Fee income expanded 10.2% as holiday spending pushed up transaction volume and enhanced economic activity. Other operating income, largely made of interchange income and secondary sales, expanded 13.0% year-over-year.
NET INTEREST MARGIN VS. OPEX
FOR U.S. CREDIT UNIONS | DATA AS OF 12.31.21
Callahan Associates | >CreditUnions.com

Labor shortages made it more expensive to hire and retain staff, which pushed up the operating expense ratio throughout 2021.
QUARTERLY PROVISION EXPENSE
FOR U.S. CREDIT UNIONS | DATA AS OF 12.31.21
Callahan Associates | CreditUnions.com
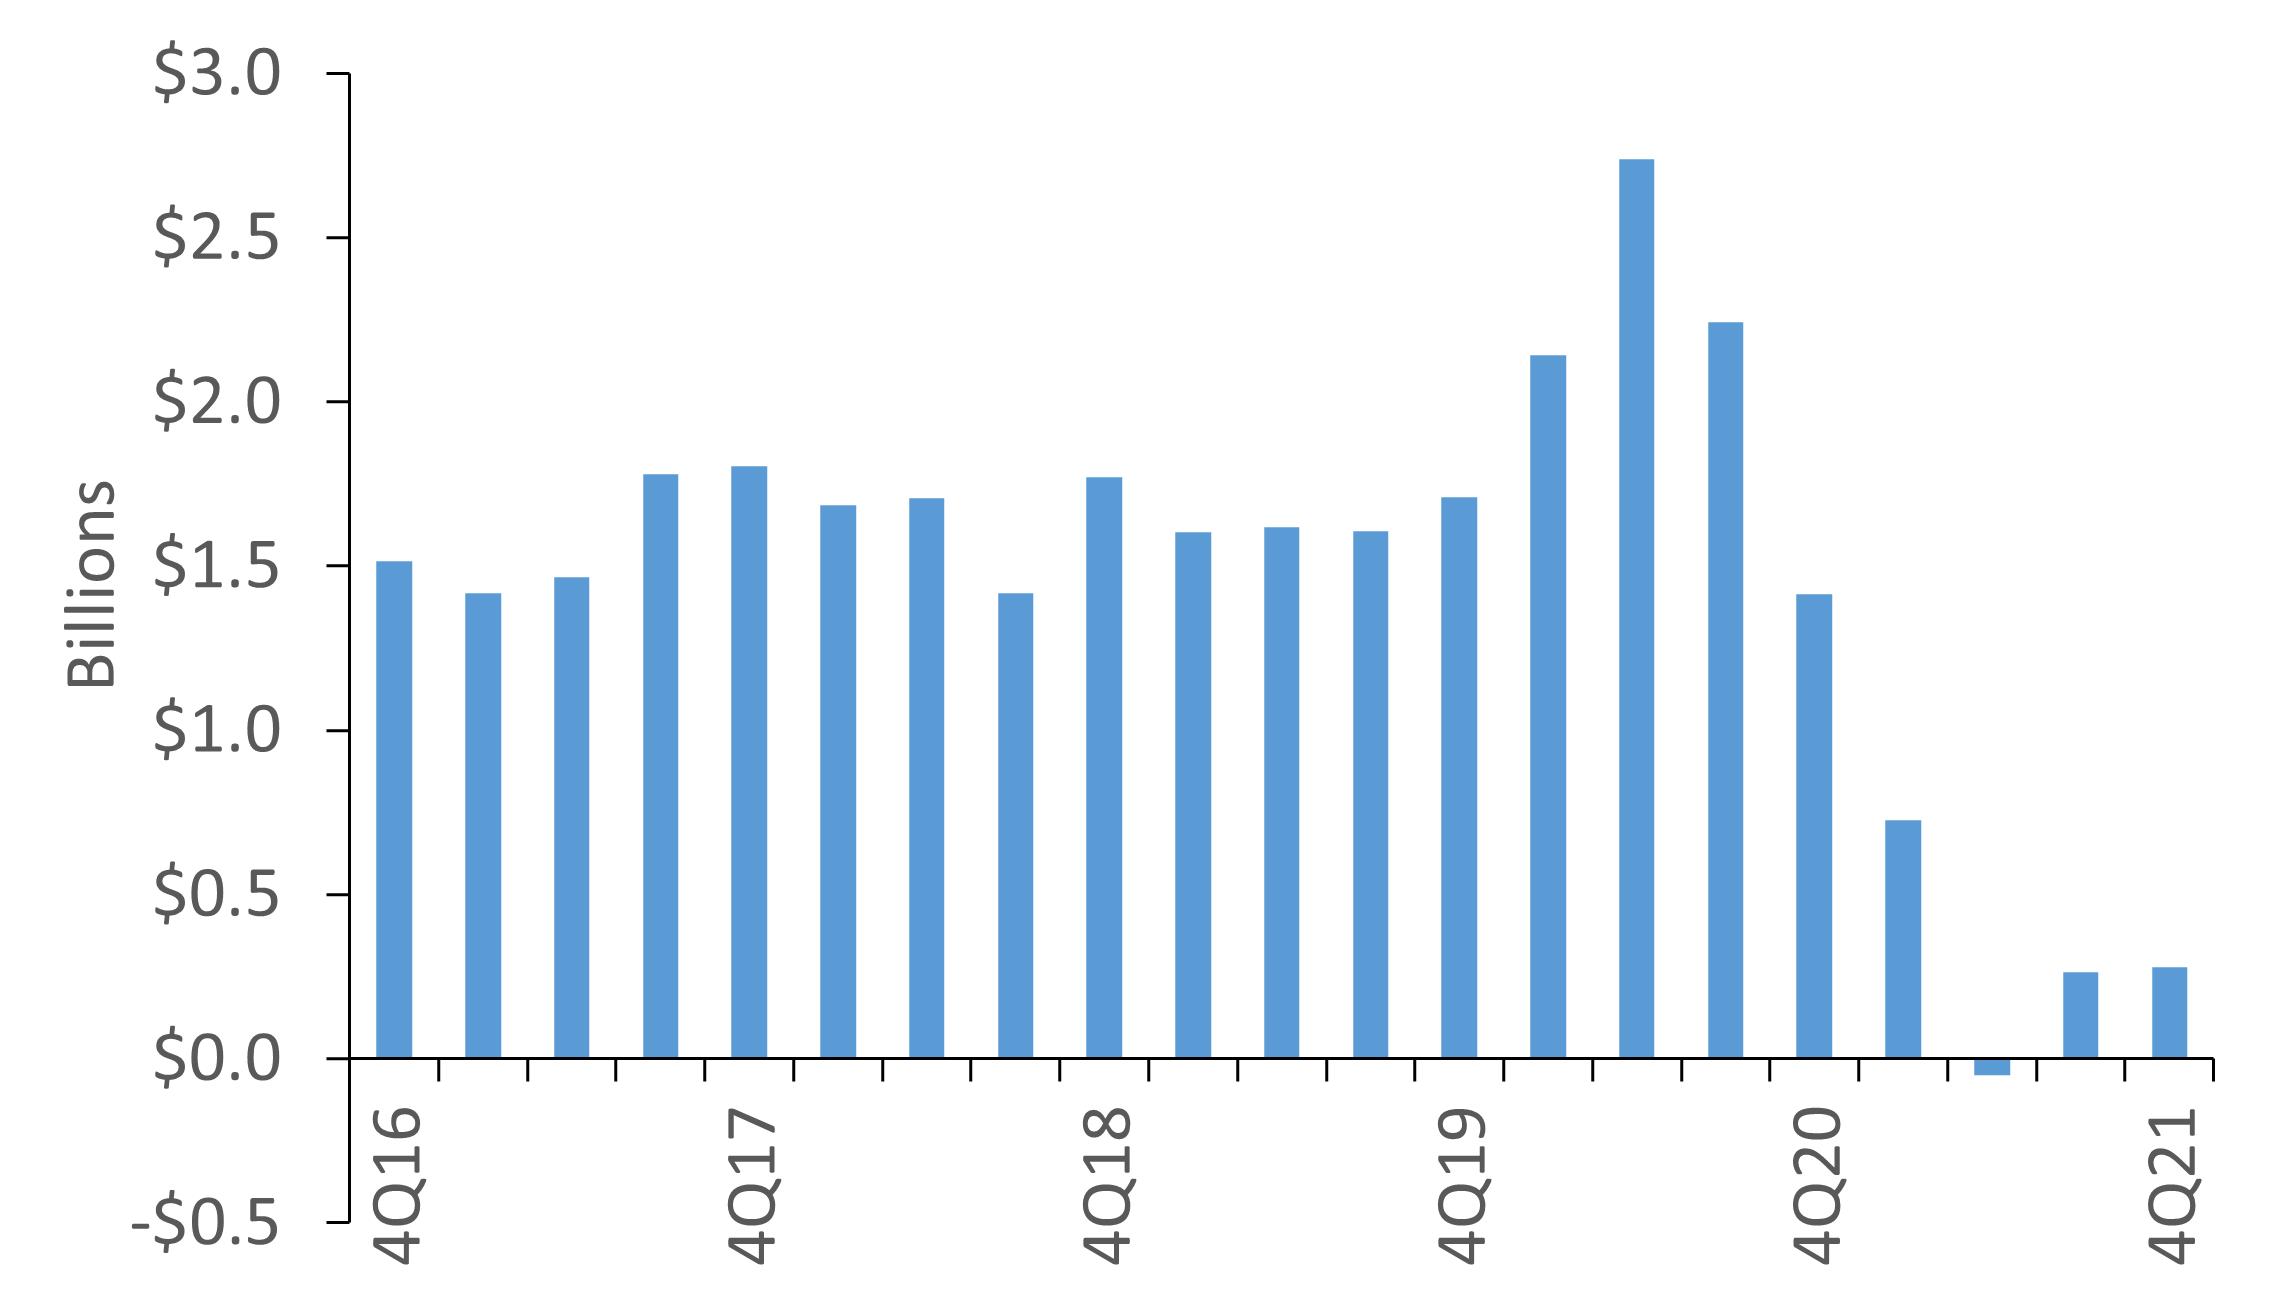
Credit unions set aside little in the way of provision expense this year as asset quality remains strong. Credit unions instead funneled these funds into earnings.
RETURN ON ASSETS
FOR U.S. CREDIT UNIONS | DATA AS OF 12.31.21
Callahan Associates| CreditUnions.com
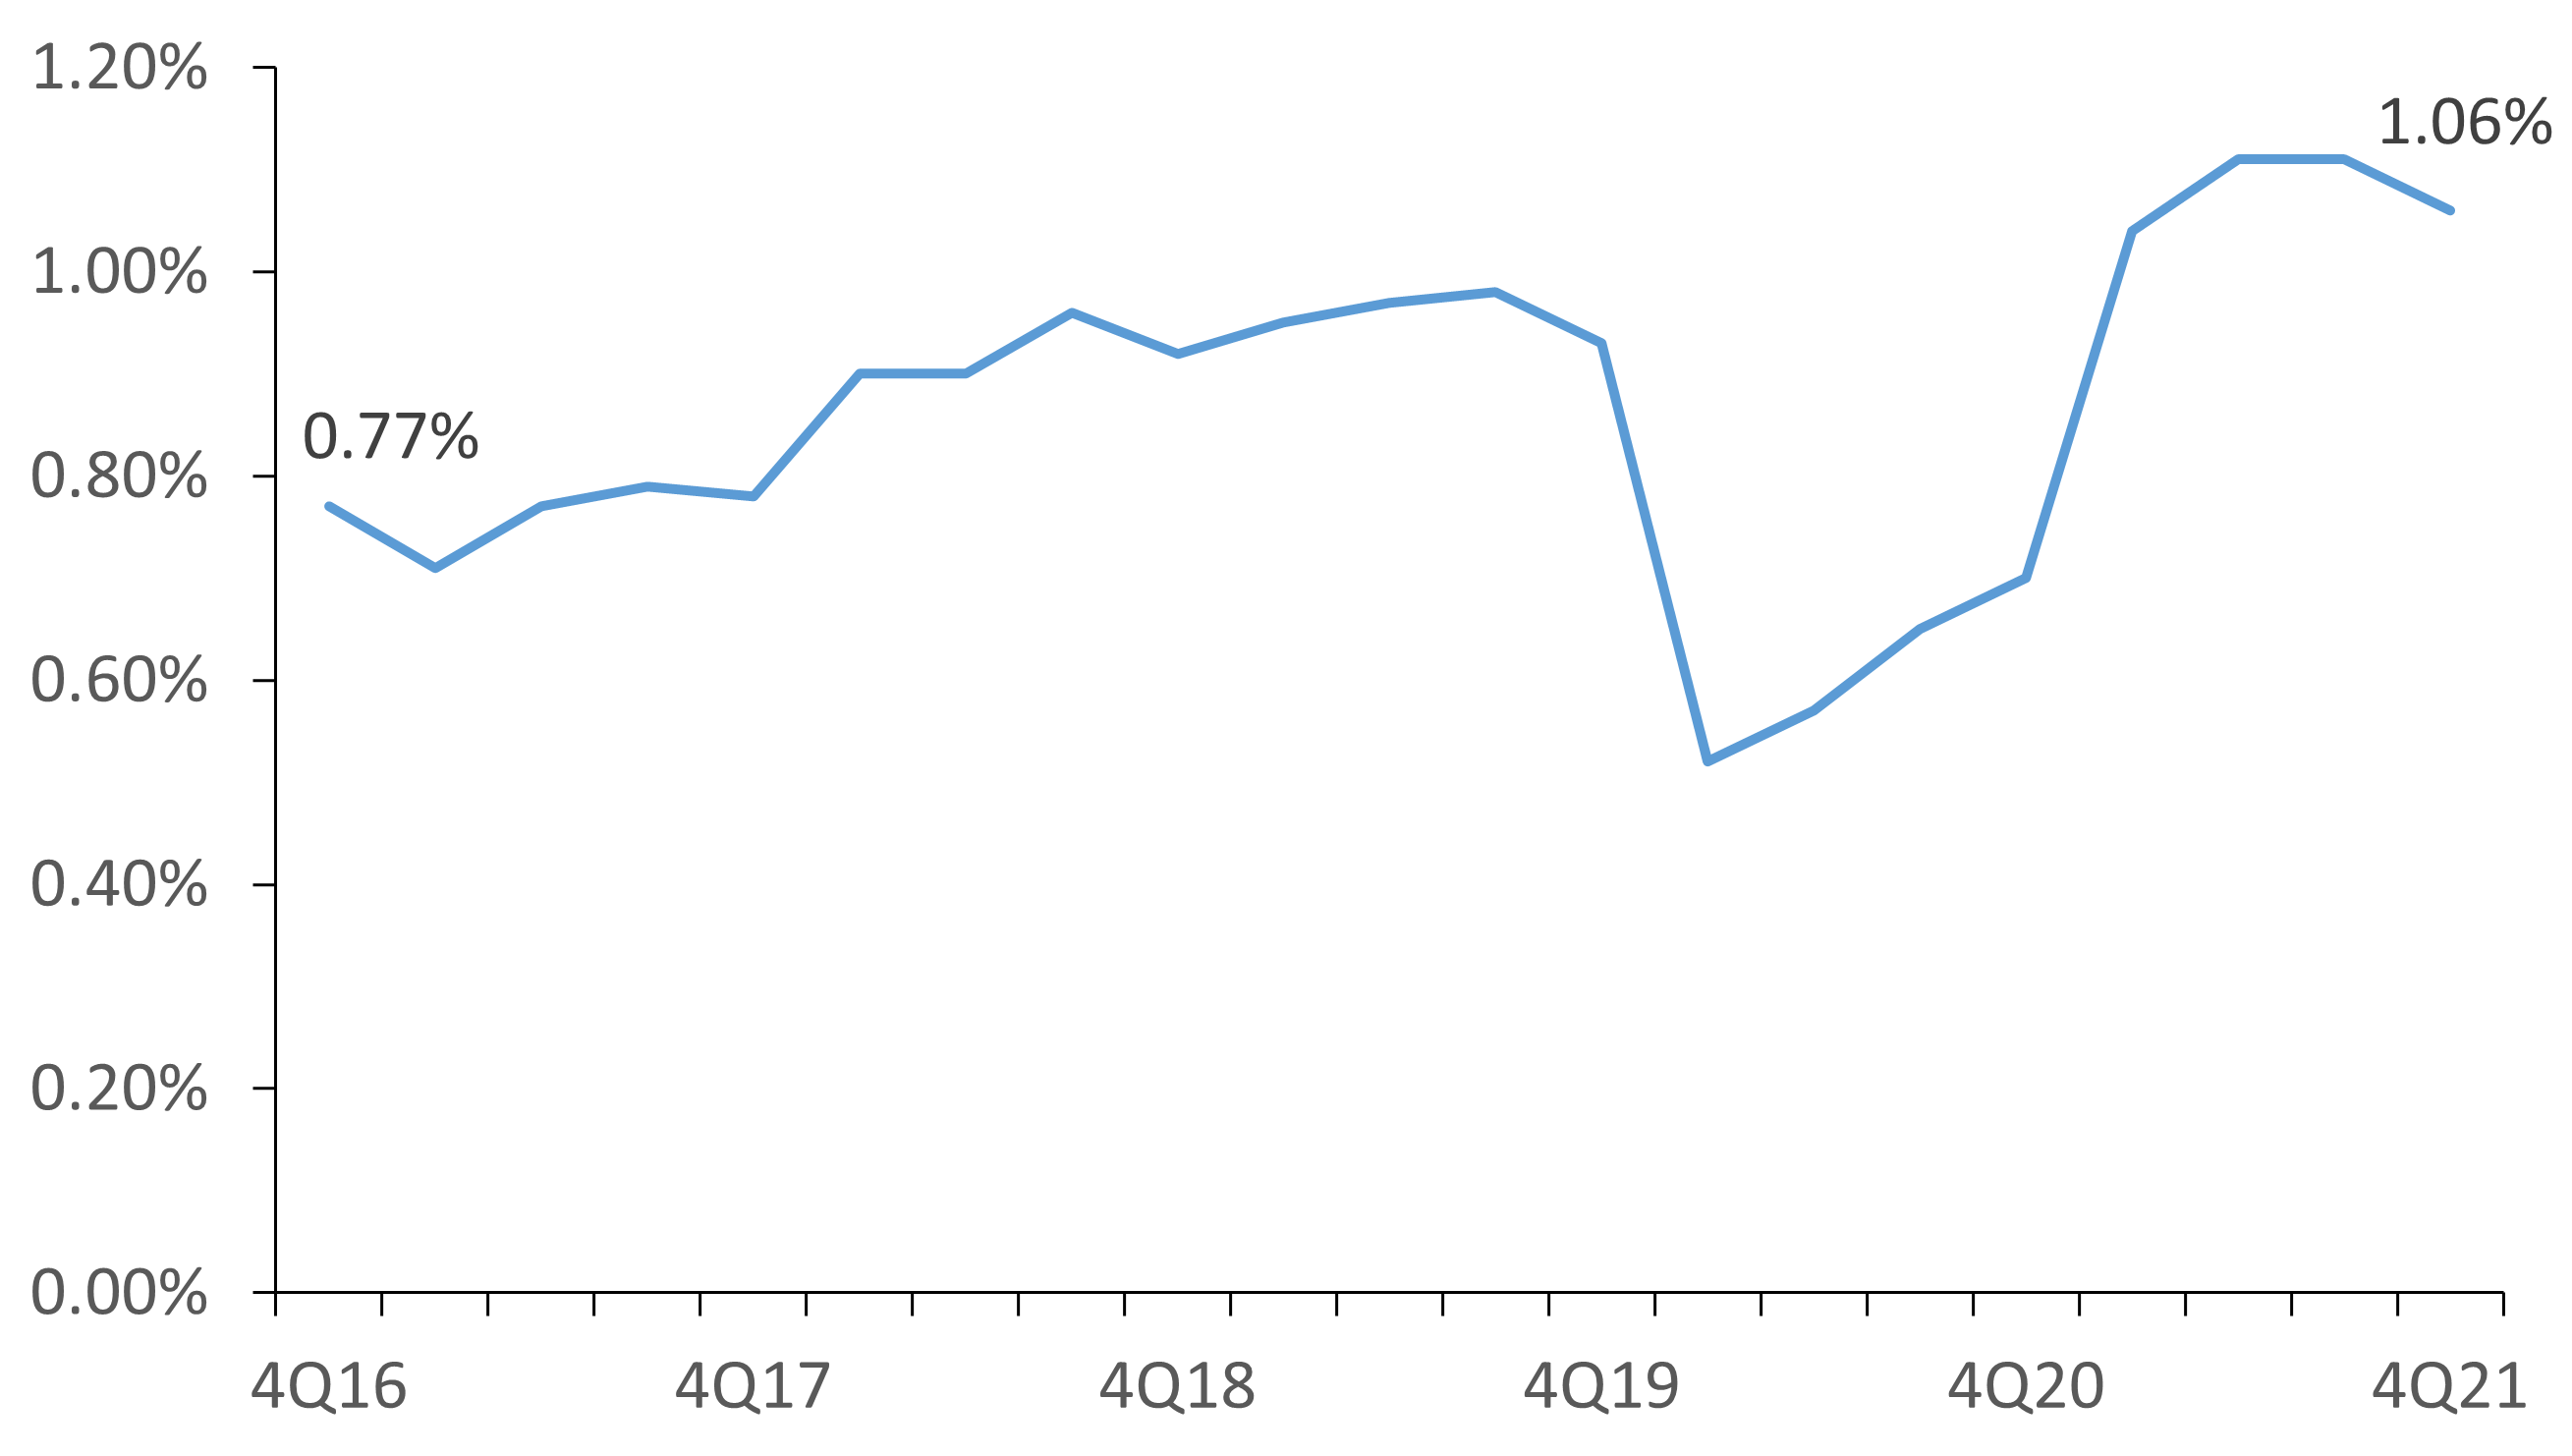
Operating expense increases cut into profits, causing year-to-date asset returns to decline 5 basis points from the third quarter.
The Bottom Line
Credit union assets increased $42.7 billion quarter-over-quarter, but cooperatives are using their assets as effectively as ever. Members remain attracted to low loan rates, and credit unions have managed to offset interest spread compression through controlling or deferring expenses.
Full-year earnings per dollar of assets reached 1.06% as of Dec. 31, down slightly from the third quarter pace but still the highest ever at year-end. Staffing and increased compensation costs remain a concern moving forward, as do new regulatory capitalization requirements from the NCUA. Still, thanks to high returns, the industry’s net worth ratio improved 3 basis points quarter-over-quarter to 10.3% at year-end.
The industry at large is well-capitalized and positioned to absorb reasonable expenses to effectively operate and invest in serving members.
Read the full analysis or skip to the section you want to read by clicking on the links below.
|
AUTO |
EARNINGS |
HUMAN CAPITAL |
|
INVESTMENTS |
LOANS |
MACRO |
|
MEMBER RELATIONSHIPS |
MORTGAGES |
SHARES |