The shifting economic landscape over the past 10 years has changed the way financial institutions operate and interact with consumers. As banks and mortgage lenders pulled back following the crash, credit unions stepped in and increased lending when members needed it most.
In the 10 years following the recession, the credit union industry has grown its loan portfolio 82.7%. Banks in the United States increased their portfolio 73.4% during the same period. Keep reading to learn how credit union lending has evolved in the past decade.
LOAN COMPOSITION 2018
FOR U.S. CREDIT UNIONS | DATA AS OF 09.30.18
© Callahan & Associates | CreditUnions.com
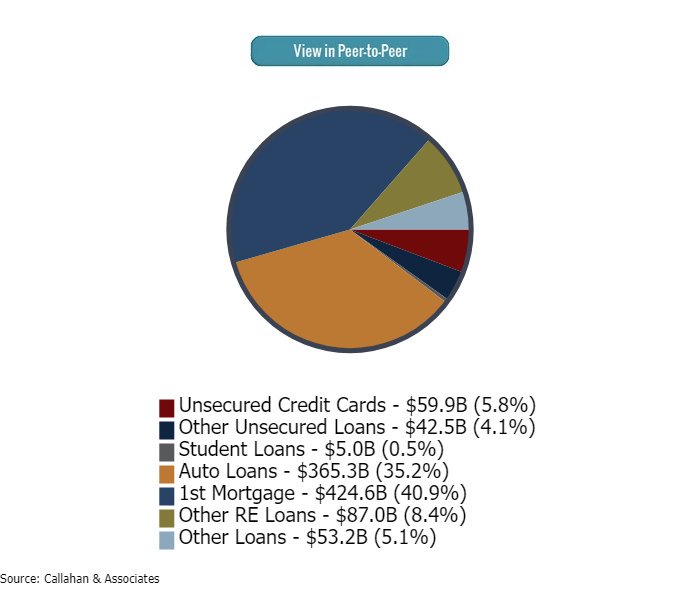
Auto and real estate loans make up a majority of the credit union loan portfolio as of 3Q18.
LOAN COMPOSITION 2008
FOR U.S. CREDIT UNIONS | DATA AS OF 09.30.08
© Callahan & Associates | CreditUnions.com

Real estate and auto loans also comprised a majority of the credit union loan portfolio in 3Q 2008 as well. The breakdown of real estate loans differed, other RE loans had a share of 17.0% of all loans, as compared to the 8.4% share in present day 3Q18.
The composition of the credit union loan portfolio has shifted in the past 10 years. Real estate lending still comprises the largest share, 49.3%, but other components have gained traction. The share of auto loans in the portfolio has increased 3.8 percentage points and totaled 35.2% of the total loan portfolio as of Sept. 30, 2018.
LOAN GROWTH
FOR U.S. CREDIT UNIONS | DATA AS OF 09.30.18
© Callahan & Associates | CreditUnions.com
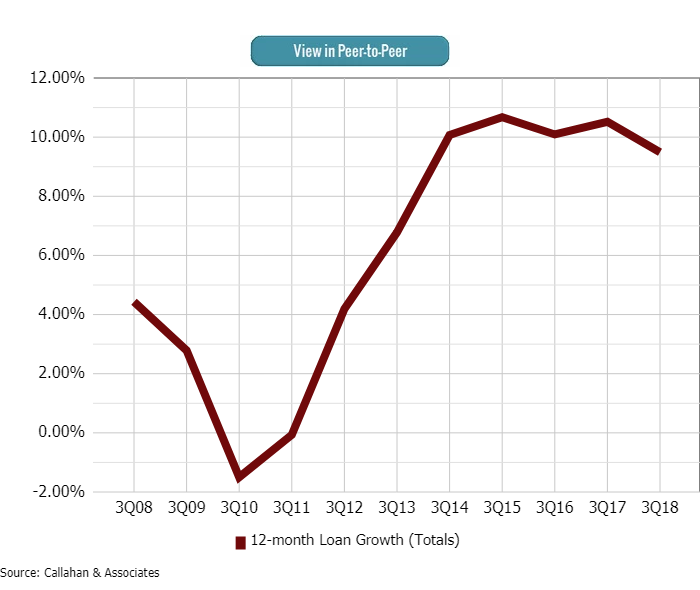
Despite slowing annual loan growth, U.S. credit unions continue to grow their portfolios to record amounts.
The industry’s total loan portfolio has grown 82.7% in the past decade, from $567.9 billion as of Sept. 30, 2008, to more than $1.0 trillion as of Sept. 30, 2018. After four years of consecutive double- digit gains, annual loan growth slowed slightly, to 9.5%, in the third quarter of 2018.
ContentMiddleAd
AVERAGE LOAN BALANCE
FOR U.S. CREDIT UNIONS | DATA AS OF 09.30.18
© Callahan & Associates | CreditUnions.com
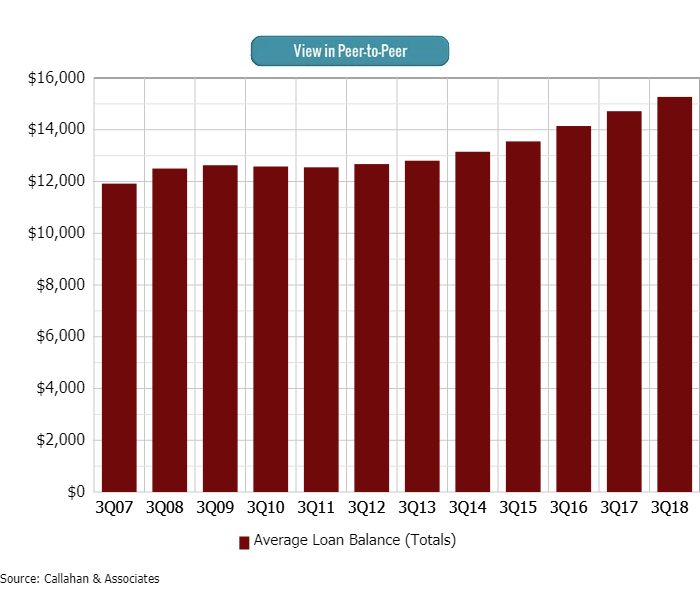
Over the past 10 years, the average loan balance for U.S. credit unions has increased 22.2%.
Nationwide, 5,551 credit unions served 116.8 million members as of Sept. 30. That’s 27.0 million more members than 10 years ago. But it’s not just the membership base at U.S. credit unions that is growing so are financial relationships. The average loan balance for credit unions in the United States has increased $2,769 in the past 120 months and reached $15,269 in the third quarter of 2018.
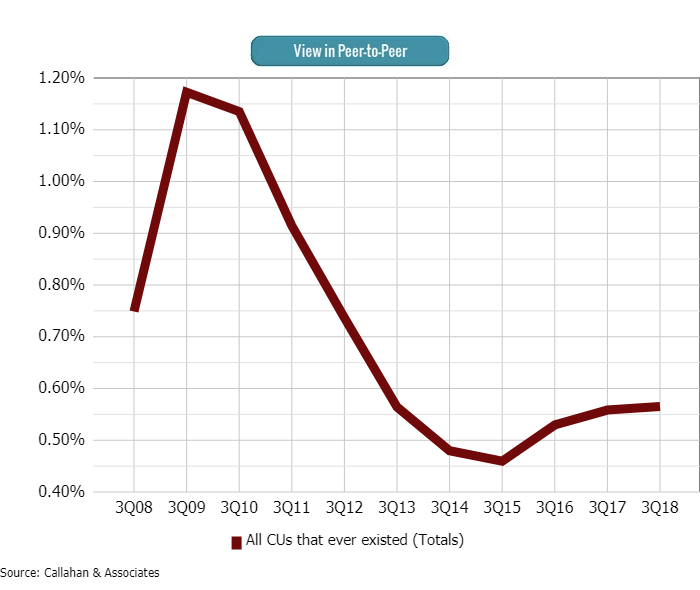
DELIQUENCY
FOR U.S. CREDIT UNIONS | DATA AS OF 09.30.18
© Callahan & Associates | CreditUnions.com
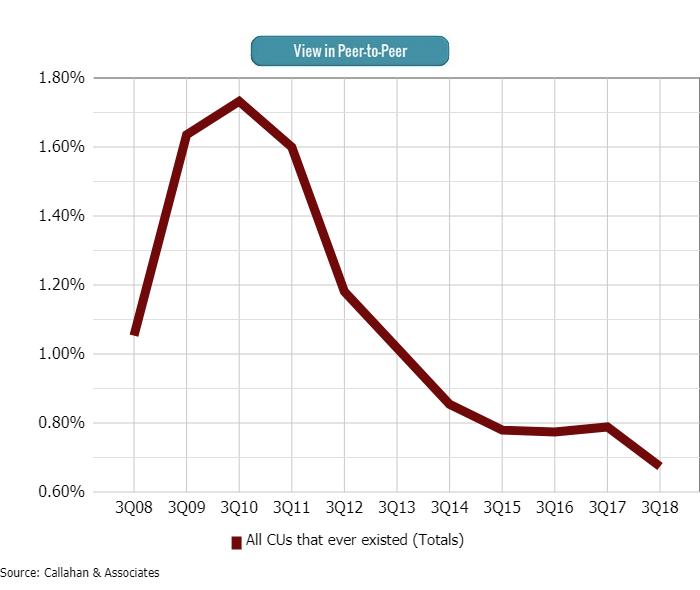
Asset quality improves as delinquency falls.
After peaking in 2010 in the years following the financial crisis, the delinquency ratio for credit unions has dramatically dropped. As of the third quarter of 2018, it was 67 basis points. This is the lowest delinquency credit unions have reported in the third quarter since 2006, when it was 59 basis points, and is a strong sign the industry’s asset quality continues to improve.
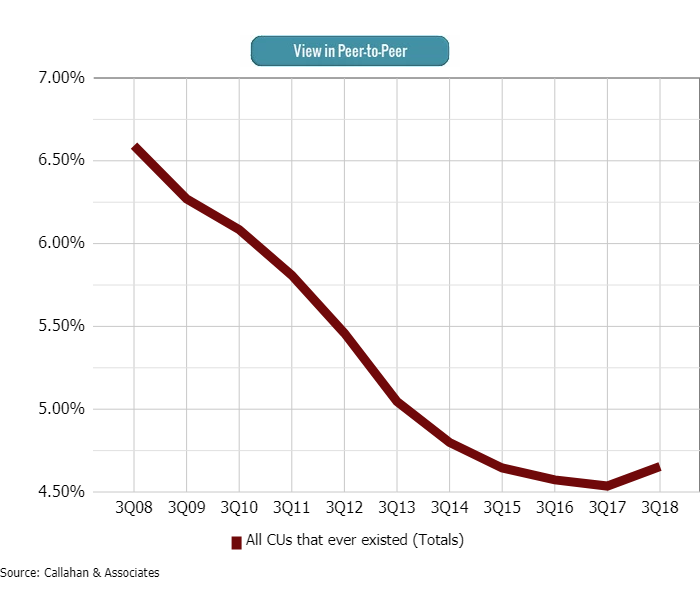
NET-CHARGE OFFS
FOR U.S. CREDIT UNIONS | DATA AS OF 09.30.18
© Callahan & Associates | CreditUnions.com
The net charge-off and delinquency ratios share a similar trend historically.
Another measure of asset quality, the net charge-off ratio has increased 1 basis point in the past year to 57 basis points. The net charge-off ratio is an indication of how well a credit union has managed credit risk in the past the lower the ratio, the sounder the credit union. Although the industry’s net charge-off ratio has increased slightly, it is still well below the 1.17% reported in third quarter of 2009.
LOAN-TO-SHARE RATIOS
FOR U.S. CREDIT UNIONS | DATA AS OF 09.30.18
© Callahan & Associates | CreditUnions.com
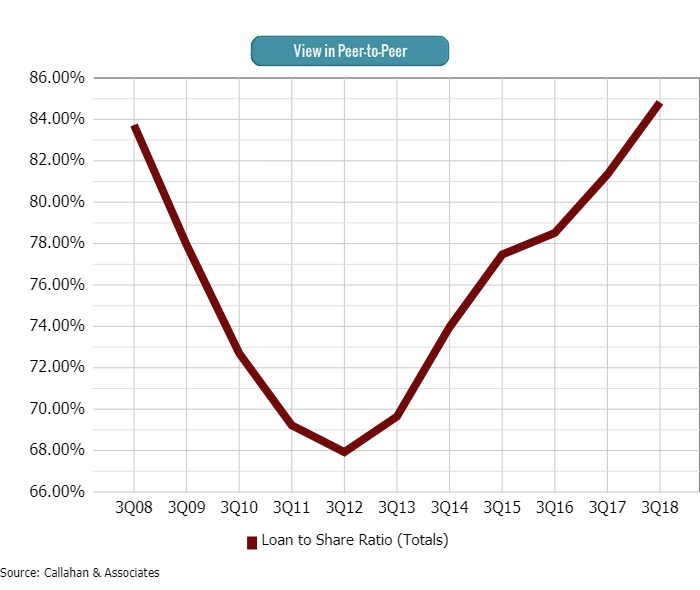
The industry’s loan-to-share ratio reached a record high in 3Q 2018.
When loan growth outpaces deposit growth, the loan-to-share ratio rises. In the past five years, the industry’s loan-to-share ratio has increased 15.2 percentage points. It increased 1.9 percentage points in the past 12 months to 84.8% as of the third quarter of 2018. That’s a record high for the credit union industry.
As the loan-to-share ratio approaches 100%, institutions commonly seek additional sources of liquidity in the form of borrowings and loan sales and try to slow loan growth via tightened lending criteria.
AVERAGE YIELD ON LOANS
FOR U.S. CREDIT UNIONS | DATA AS OF 09.30.18
© Callahan & Associates | CreditUnions.com
After falling 205 basis points between 3Q 2008 to 3Q 2017, the average yield on loans rose 11 basis point year-over-year as of 3Q 2018.
Yield on loans rose 11 basis points year-over-year to 4.66% in the third quarter of 2018. Gradually increasing interest rates has helped to push loan interest income 12.6% higher to $35.0 billion as of Sep. 30, 2018.
FIRST MORTGAGES
FOR U.S. CREDIT UNIONS | DATA AS OF 09.30.18
© Callahan & Associates | CreditUnions.com
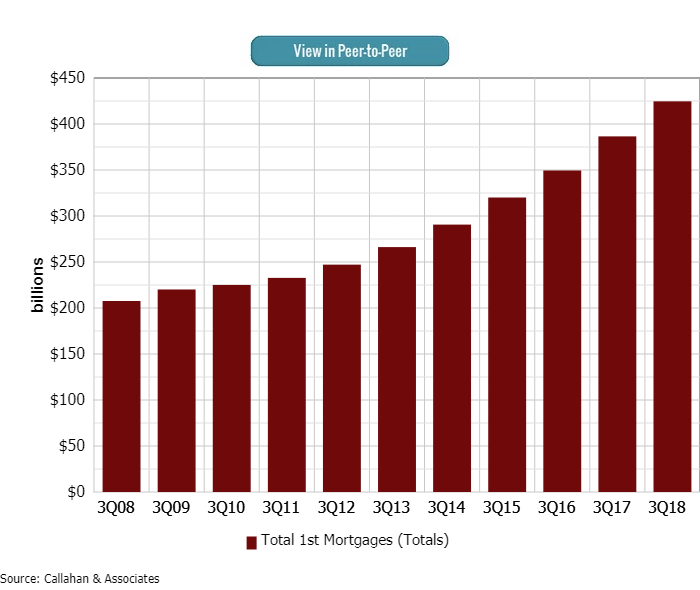
Over the past 10 years, 1st mortgage loan balances increased $217.0 billion.
Credit unions held $424.6 billion in first mortgage balances as of Sept. 30, 2018. This segment accounted for 40.9% of the industry’s total loan portfolio in the third quarter the largest share of any loan product. First mortgage loan growth surpassed total loan growth by 36 basis points, an increase of 9.9% year-over-year.
LOAN PENETRATION
FOR U.S. CREDIT UNIONS | DATA AS OF 09.30.18
© Callahan & Associates | CreditUnions.com
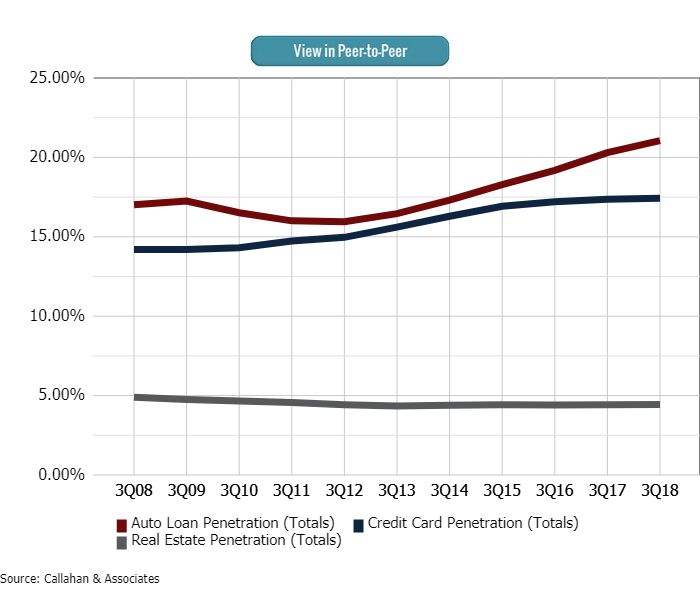
Penetration rates are up across auto, credit card and real estate loan products.
Credit unions in the United States are serving more members than ever. They are also forming deeper relationships with those members via a growing diversity of products and services. The percentage of credit union members who have a credit union auto loan, real estate loan, or credit card has increased year-over-year. For auto loans, penetration grew from 20.3% in the third quarter of 2017 to 21.1% in 2018.
LOAN GROWTH BY TYPE
FOR U.S. CREDIT UNIONS | DATA AS OF 09.30.18
© Callahan & Associates | CreditUnions.com
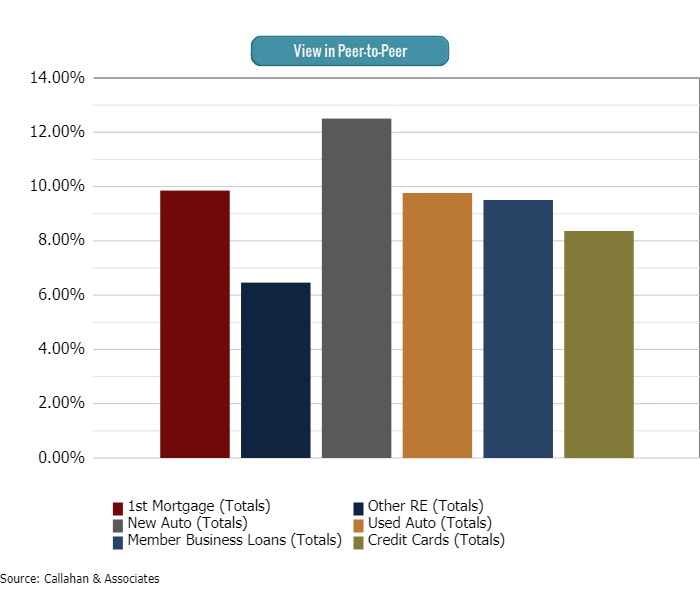
New auto loans posted the strongest annual growth across all loan products.
The industry’s total loan portfolio increased 9.5% annually, and each segment of the portfolio posted strong growth individually. Credit unions reported the strongest growth in new auto loans, which increased 12.5% year-over-year and reached $145.5 billion as of Sept. 30, 2018. Together, new and used auto loans comprised 35.2% of the total loan portfolio as of the third quarter.
Dig Deeper Into Your Lending Numbers
Want to see how your lending numbers stack up against your peers? Build displays, filter data, track performance, and more with Callahan’s Peer-to-Peer. Let us walk you through your numbers with a custom performance audit.