Read the full analysis or skip to the section you want to read by clicking on the links below.
| LENDING | AUTO LENDING | AUTO MARKET SHARE MAP | ||
| MORTGAGE LENDING | CREDIT CARDS | SHARES | ||
| MEMBER BUSINESS LOANS | INVESTMENTS | MEMBER RELATIONSHIPS | ||
| EARNINGS | EMPLOYEE PRODUCTIVITY | LENDING | AUTO LENDING | AUTO MARKET SHARE MAP |
General Lending
It’s Onward And Upward With A Record-Shattering Start To The Year
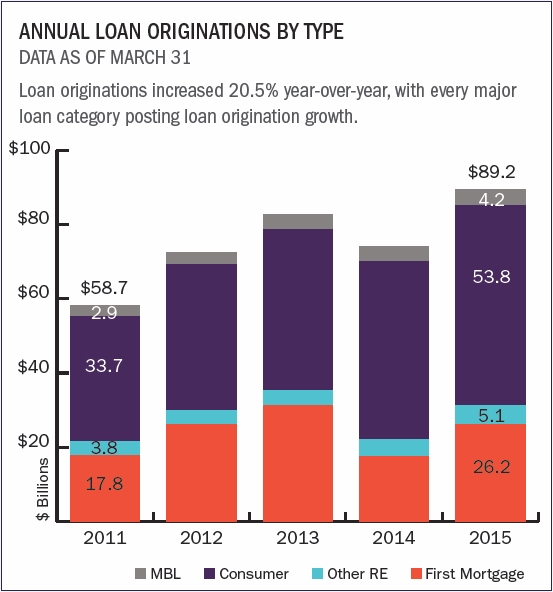
Credit unions originated $89.2 billion in loans in the first quarter of 2015. This 20.5% year-over-year increase set an all-time record for the first quarter. Consumer lending drove some of these gains, rising 11.8% year-over-year. But first mortgage originations roared even further ahead, increasing 49.6% from the same period a year ago.
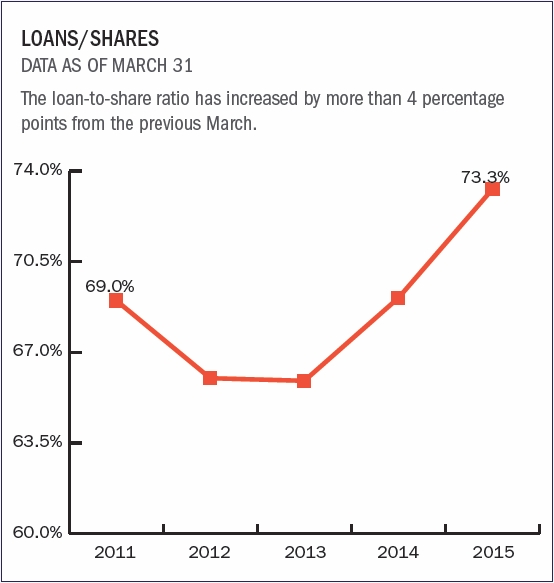
With this growth in originations, outstanding loan growth was nearly 2.5 times the rate of share growth at 10.6% versus 4.4%. In many markets, this trend helped further ease any remaining liquidity concerns left over from the post-recession consumer spending slowdown.

Source for all graphs, rankings, and maps unless otherwise noted:Peer-to-Peer Analytics by Callahan & Associates.
| LENDING | AUTO LENDING | AUTO MARKET SHARE MAP | ||
| MORTGAGE LENDING | CREDIT CARDS | SHARES | ||
| MEMBER BUSINESS LOANS | INVESTMENTS | MEMBER RELATIONSHIPS | ||
| EARNINGS | EMPLOYEE PRODUCTIVITY | LENDING | AUTO LENDING | AUTO MARKET SHARE MAP |
Auto Lending
Home To The Fastest Growth
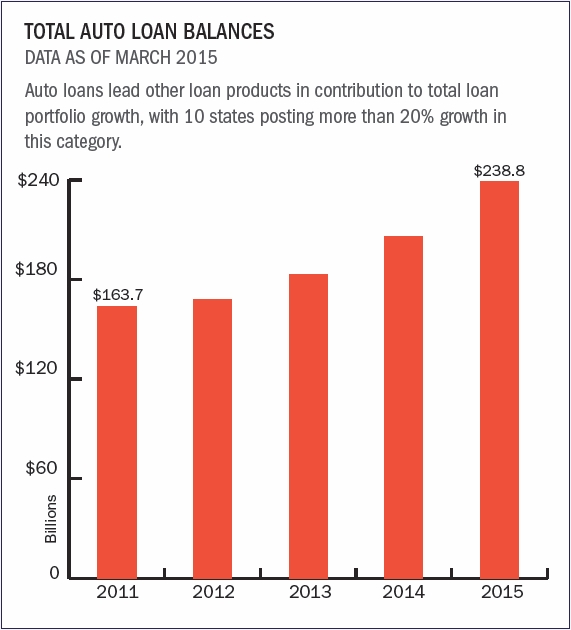
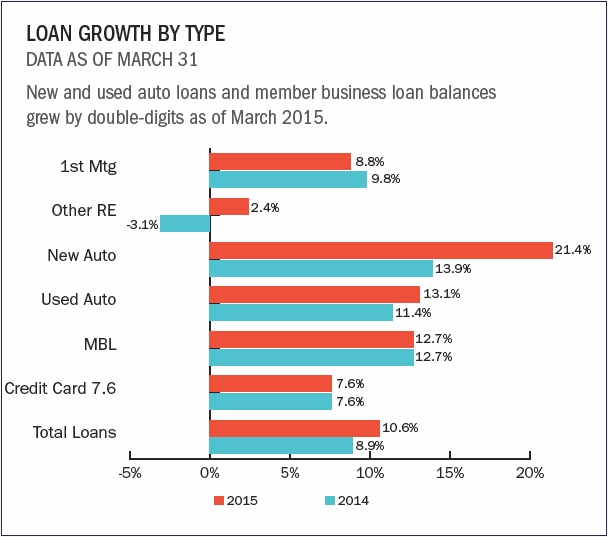
As of March 2015, the overall auto loan portfolio grew 16.1% year-over-year to nearly $239 billion, marking five consecutive quarters in which auto loans have posted double-digit growth.
Among all loan categories this quarter, new auto loans had the largest percentage increase compared to the previous March, rising 21.4% to $90.0 billion. As the second largest component of the industry’s loan portfolio after first mortgagees, used auto loans also grew 13.1% year-over-year to reach $148.7 billion.
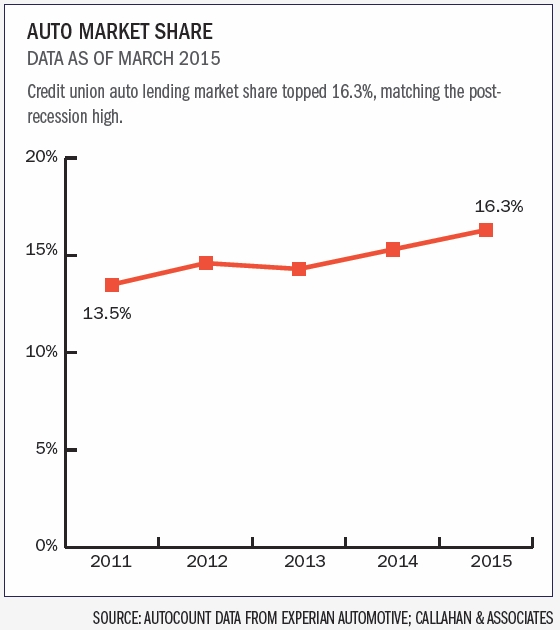
Credit unions are more than holding their own against banks and other captive auto finance companies, with some relying on competitive rates to stake out a larger claim. According to AutoCount data from Experian Automotive, the industry’s year-to-date market share for auto originations grew to 16.3% in the first quarter of 2015, up from 15.3% one year ago.

Source for all graphs, rankings, and maps unless otherwise noted:Peer-to-Peer Analytics by Callahan & Associates.
| LENDING | AUTO LENDING | AUTO MARKET SHARE MAP | ||
| MORTGAGE LENDING | CREDIT CARDS | SHARES | ||
| MEMBER BUSINESS LOANS | INVESTMENTS | MEMBER RELATIONSHIPS | ||
| EARNINGS | EMPLOYEE PRODUCTIVITY | LENDING | AUTO LENDING | AUTO MARKET SHARE MAP |
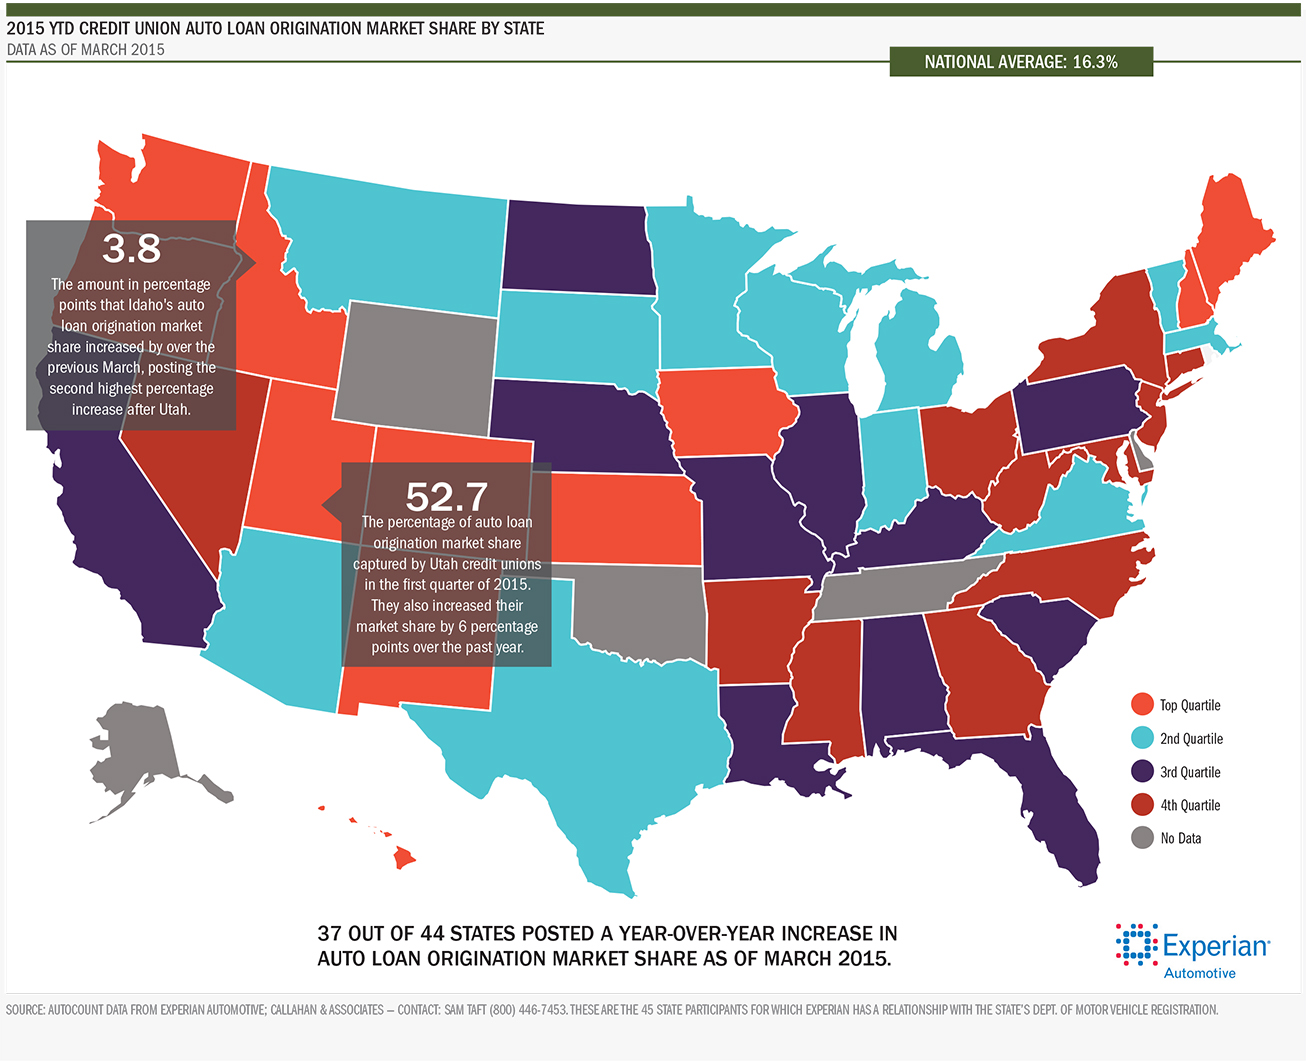
Auto Market Share Map
Source for all graphs, rankings, and maps unless otherwise noted:Peer-to-Peer Analytics by Callahan & Associates.
| LENDING | AUTO LENDING | AUTO MARKET SHARE MAP | ||
| MORTGAGE LENDING | CREDIT CARDS | SHARES | ||
| MEMBER BUSINESS LOANS | INVESTMENTS | MEMBER RELATIONSHIPS | ||
| EARNINGS | EMPLOYEE PRODUCTIVITY | LENDING | AUTO LENDING | AUTO MARKET SHARE MAP |
Mortgage Lending
Not Top Of Mind Yet, But Making Steady Gains
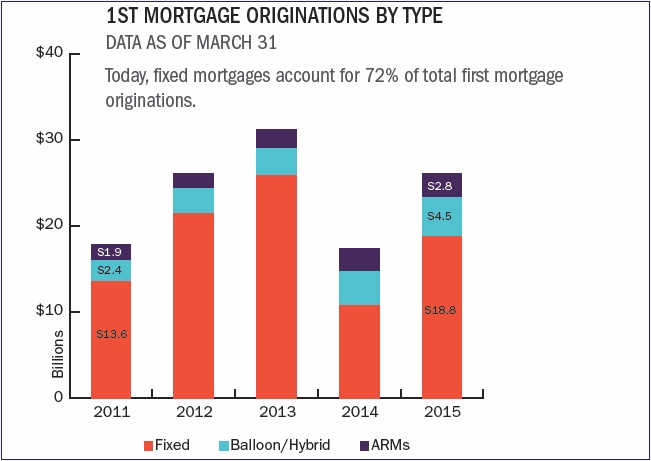
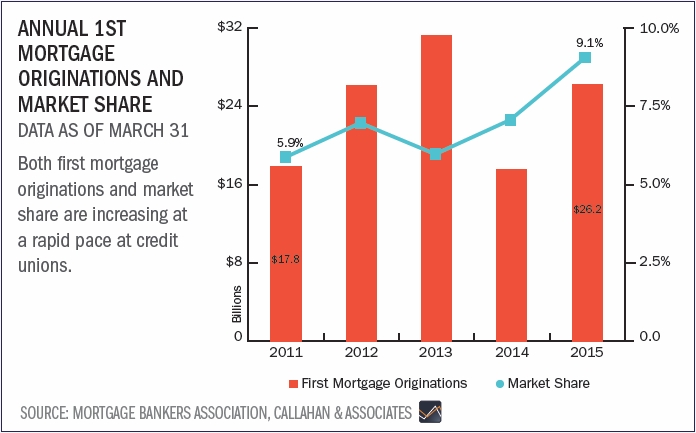
Credit unions originated $26.2 billion in mortgages in the first quarter of 2015 alone. Fixed rate mortgages were the most popular product for that period, accounting for 71.9% of total first mortgage originations. That’s higher than the 61.5% seen in 1Q 2014, but still below the recent high of 83.2% set in 1Q 2013. Conversely, adjustable rate and balloon/hybrid mortgages accounted for 28.1% of total first mortgage originations during the first quarter, down from last March when they comprised 38.5%.
Due to the industry’s resounding success with fixed rate firsts and a favorable rate environment, overall credit union mortgage origination activity boomed in the first quarter, growing 49.6% from the $17.5 billion originated in the first three months of 2014.
There were also key gains made in homebuyer awareness this year. In total, the cooperative industry accounted for 9.1% of all U.S. mortgage originations, according to the Mortgage Bankers Association. This is a notable improvement from the 7.1% market share captured in the first quarter of 2014.
In addition, although credit unions held roughly the same amount of mortgages on their balance sheets as in previous years, sales to the secondary market increased from 32.4% in March 2014 to 38.6% this year.
Source for all graphs, rankings, and maps unless otherwise noted:Peer-to-Peer Analytics by Callahan & Associates.
| LENDING | AUTO LENDING | AUTO MARKET SHARE MAP | ||
| MORTGAGE LENDING | CREDIT CARDS | SHARES | ||
| MEMBER BUSINESS LOANS | INVESTMENTS | MEMBER RELATIONSHIPS | ||
| EARNINGS | EMPLOYEE PRODUCTIVITY | LENDING | AUTO LENDING | AUTO MARKET SHARE MAP |
Credit Cards
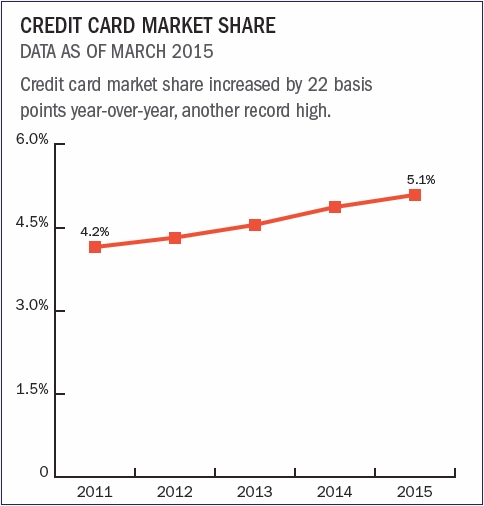
More Members Take Advantage Of Responsible, Affordable Card Offerings
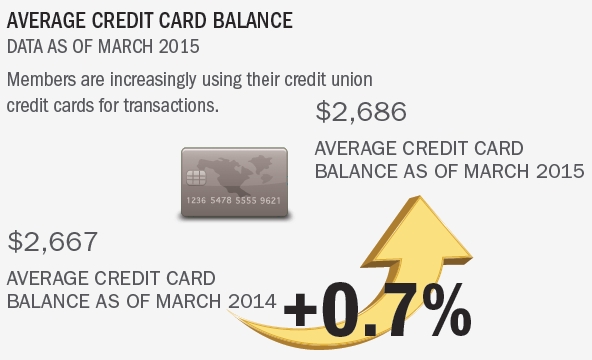
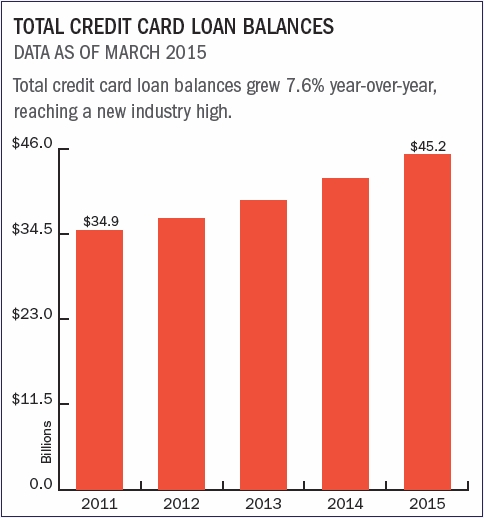
Credit unions reported a robust 7.6% annual growth in credit cards as of March 2015. Total balances outstanding reached $45.2 billion and the average balance per card grew 0.7% year-over-year, compared to a just 38 basis point increase the previous March ($2,686 versus $2,667).
The percentage of members with a credit union credit card increased 55 basis points over the past twelve months to reach 16.6% at the end of the first quarter 2015. Credit card market share also increased, from 4.87% in March 2014 to 5.09% in March 2015.
Source for all graphs, rankings, and maps unless otherwise noted:Peer-to-Peer Analytics by Callahan & Associates.
| LENDING | AUTO LENDING | AUTO MARKET SHARE MAP | ||
| MORTGAGE LENDING | CREDIT CARDS | SHARES | ||
| MEMBER BUSINESS LOANS | INVESTMENTS | MEMBER RELATIONSHIPS | ||
| EARNINGS | EMPLOYEE PRODUCTIVITY | LENDING | AUTO LENDING | AUTO MARKET SHARE MAP |
Shares
Consumers Short-Term Focus Has Helped Keep Shares Moderate And Manageable
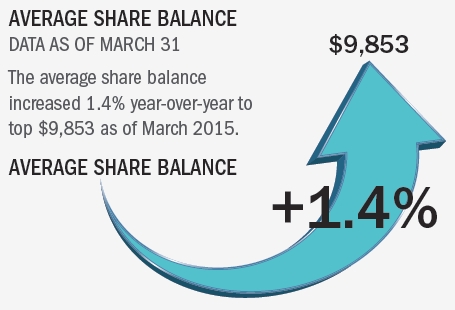
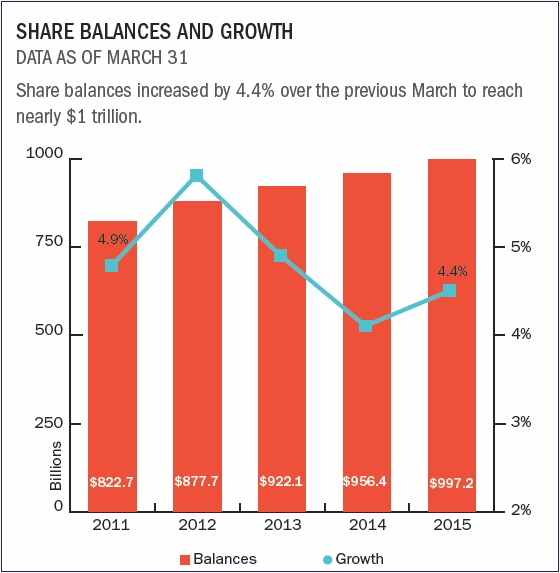
Members added $41.7 billion in share balances over the past twelve months to top $997.2 billion as of March, representing a 4.4% year-over-year growth. Although this metric was stable in the first quarter of 2015, the spread between loan growth and share growth is widening as loan growth continues to accelerate. Since the third quarter of 2013, the annual net liquidity change (annual share growth minus annual loan growth) has been negative.
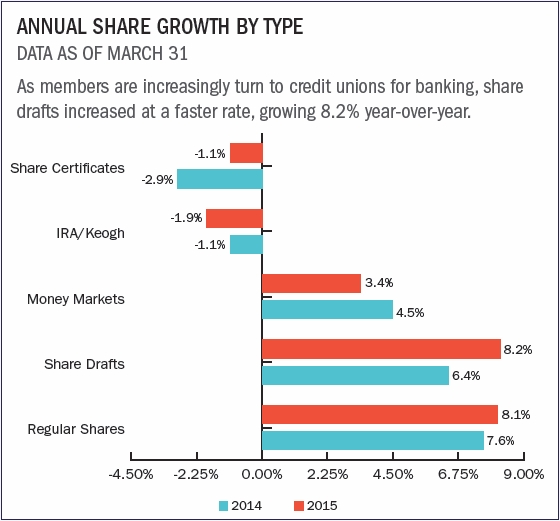
Core deposit categories made up most of the growth in this area. Share draft balances were the fastest growing, up 8.2% over the same period to reach nearly $141.8 billion while regular shares posted the second largest increase over the past year, growing by 8.1% to reach $360 billion. Even money market balances increased by 3.4% since last March to reach $227.5 billion.
Longer-term savings options have remained relatively unpopular, as members are still hesitant to lock up their funds in a low interest rate environment. As a result, IRA/Keogh balances are down 1.9% from last March, while share certificate balances have also declined 1.1% over the same period.
Source for all graphs, rankings, and maps unless otherwise noted:Peer-to-Peer Analytics by Callahan & Associates.
| LENDING | AUTO LENDING | AUTO MARKET SHARE MAP | ||
| MORTGAGE LENDING | CREDIT CARDS | SHARES | ||
| MEMBER BUSINESS LOANS | INVESTMENTS | MEMBER RELATIONSHIPS | ||
| EARNINGS | EMPLOYEE PRODUCTIVITY | LENDING | AUTO LENDING | AUTO MARKET SHARE MAP |
Member Business Lending
One In Three Credit Unions Now Engage In This Complex But Lucrative Business Line
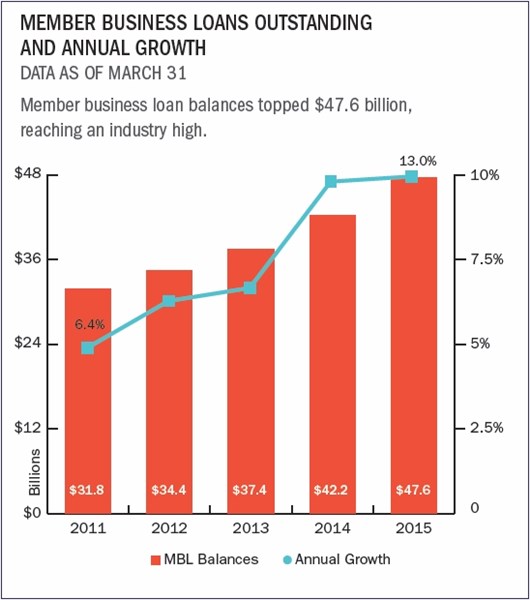

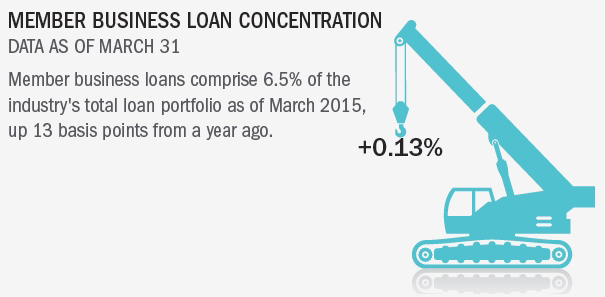
Although they represent just 6.5% of the industry’s loan portfolio, member business loans are becoming an increasingly important part of some credit unions suite of products. Throughout the industry, 33.8% of credit unions now offer business loans, up from 32.6% last year.
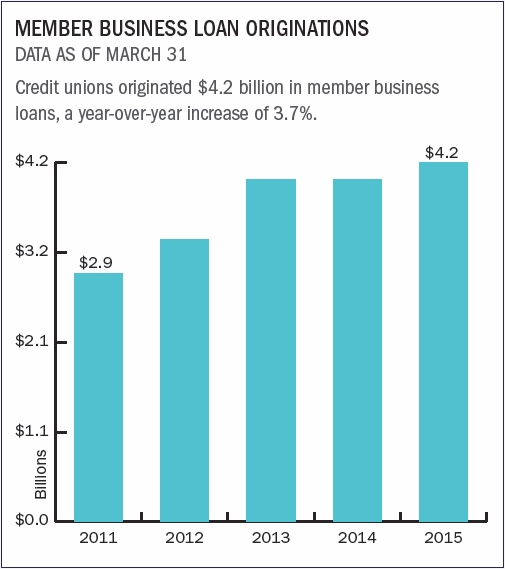
As of March 31, these cooperatives reported outstanding business loan balances of $47.6 billion, an increase of 13.0% from a year ago. Over the same period, credit unions originated $4.2 billion in member business loans, up 3.7% from March 2014. In total, 81% of the member business loan portfolio was secured by real estate, with the second largest portion of the portfolio comprised by commercial and industrial loans at 13%.
Source for all graphs, rankings, and maps unless otherwise noted:Peer-to-Peer Analytics by Callahan & Associates.
| LENDING | AUTO LENDING | AUTO MARKET SHARE MAP | ||
| MORTGAGE LENDING | CREDIT CARDS | SHARES | ||
| MEMBER BUSINESS LOANS | INVESTMENTS | MEMBER RELATIONSHIPS | ||
| EARNINGS | EMPLOYEE PRODUCTIVITY | LENDING | AUTO LENDING | AUTO MARKET SHARE MAP |
Investments
A Shift In Yield Despite Growing Emphasis


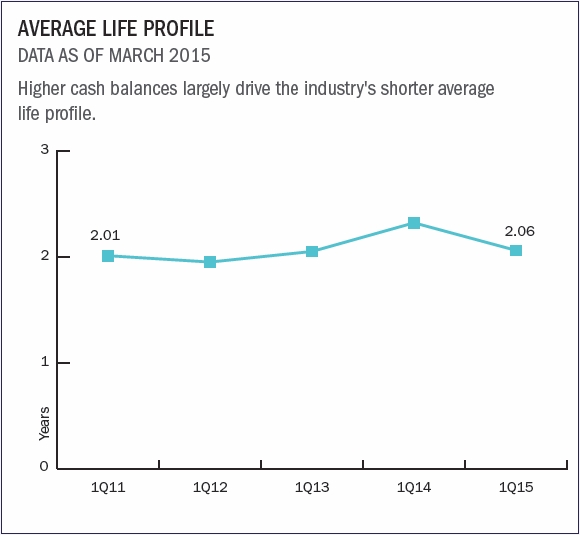
The credit union industry held more than $391 billion in investments as of March 2015. Total investment balances increased by $24.5 billion from the previous quarter’s $366 billion and the seasonal pattern of increased investments in the first quarter continues hold true as members deposit their tax refunds and bonus payments.
For the first time in two years, the average yield on investments has decreased from the previous quarter. Increased cash positions and higher coupon securities maturing have led to a 4 basis point decrease from 1.24% to 1.20% as of March 2015. Thanks to the decline in the overall yield of the portfolio and larger cash balances, the average life of all investments (including cash) fell from 2.21 years in the fourth quarter of 2014 to 2.06 years in the first quarter of 2015.
Source for all graphs, rankings, and maps unless otherwise noted:Peer-to-Peer Analytics by Callahan & Associates.
| LENDING | AUTO LENDING | AUTO MARKET SHARE MAP |
| MORTGAGE LENDING | CREDIT CARDS | SHARES |
| MEMBER BUSINESS LOANS | INVESTMENTS | MEMBER RELATIONSHIPS |
| EARNINGS | EMPLOYEE PRODUCTIVITY |
Employee Productivity: Then And Now
Callahan data provides a detailed look at the evolution of cooperative workspace over the last 15 years.
Click To View Larger

Click To View Larger

Source for all graphs, rankings, and maps unless otherwise noted: Peer-to-Peer Analytics by Callahan & Associates.