Read the full analysis or skip to the section you want to read by clicking on the links below.
| LENDING | AUTO LENDING | AUTO MARKET SHARE MAP |
| MORTGAGE LENDING | CREDIT CARDS | MEMBER BUSINESS LENDING |
| SHARES | INVESTMENTS | MEMBER RELATIONSHIPS |
| EARNINGS | SPECIAL SECTION: CREDIT UNIONS VS. BANKS | |
Lending
Ready, Set, Go!
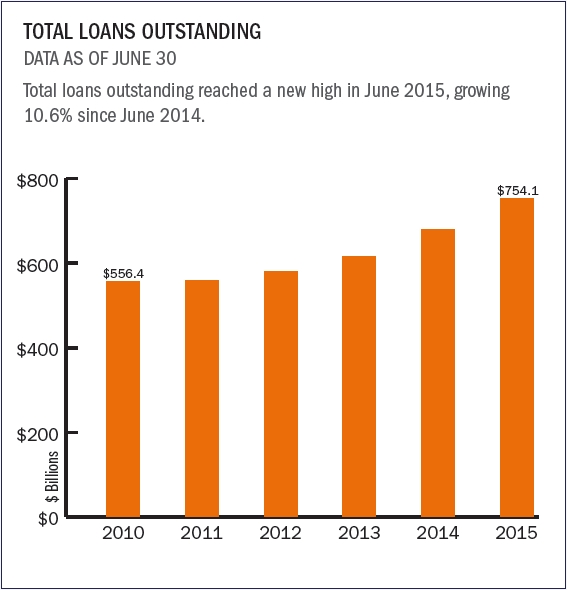
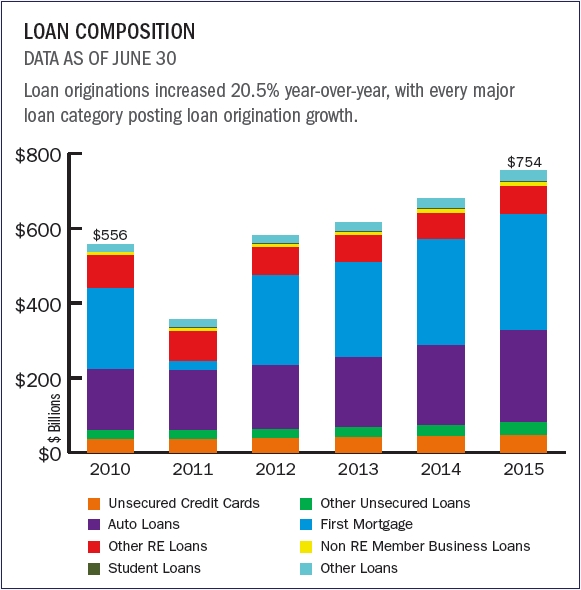
So far, 2015 looks primed to be a record-breaking year for lending among the nation’s 6,284 credit unions as year-to-date loan originations reached an all-time second quarter high of $200.3 billion. First mortgage originations alone were up 20.3% this June versus one year prior. Interest income increased year-over-year to reach $19.4 billion and non-interest income also grew at a faster rate, indicating that credit unions are finding other ways to raise funds. Despite higher income, ROA declined by one basis point year-over-year because of increased operating expenses, reaching 0.81% in June 2015.
Click To View Larger
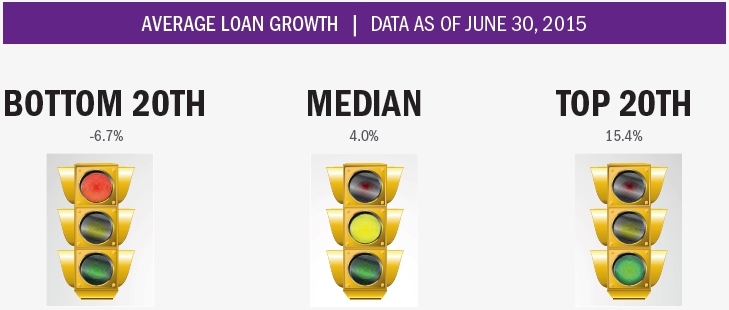
The industry median for average loan growth was 4.0% as of June 2015, an increase from the 3.2% reported in June 2014. Top-performing credit unions reaching the top 20th percentile experienced 15.4% loan growth on average, while credit unions in the bottom 20th percentile reported a 6.7% decrease.
Source for all graphs, rankings, and maps unless otherwise noted:Peer-to-Peer Analytics by Callahan & Associates.
| LENDING | AUTO LENDING | AUTO MARKET SHARE MAP |
| MORTGAGE LENDING | CREDIT CARDS | MEMBER BUSINESS LENDING |
| SHARES | INVESTMENTS | MEMBER RELATIONSHIPS |
| EARNINGS | SPECIAL SECTION: CREDIT UNIONS VS. BANKS | |

Auto Lending
A Classic Business Line Now Picking Up Speed
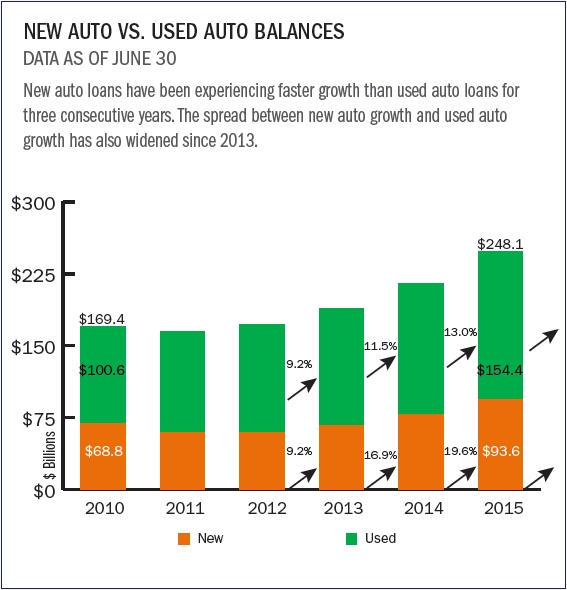
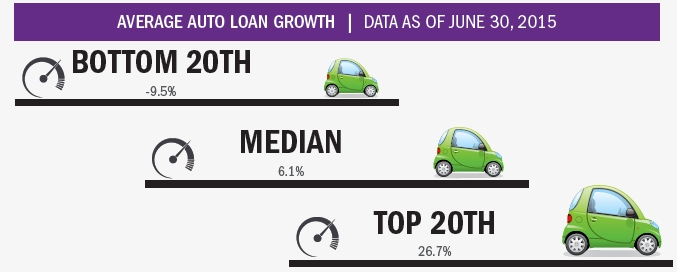
Outstanding auto loan balances at credit unions reached $248.1 billion as of June 2015, growing 15.4% year-over-year. Both new and used categories were up 19.6% and 13.0%, respectively, over the previous June’s numbers. Indirect lending has continued to play a key role in this strong performance. With balances topping $125.4 billion and growing 21.9% year-over-year, indirect auto loans increased at a rate that was nearly 12 percentage points faster than direct auto loans.
Click To View Larger
Nationwide, median auto loan balances grew 6.1% year-over-year. Credit unions reaching the top 20th percentile reported an average auto loan growth of 26.7% while those in the bottom 20th percentile reported a 9.5% decline on average.
Source for all graphs, rankings, and maps unless otherwise noted:Peer-to-Peer Analytics by Callahan & Associates.
| LENDING | AUTO LENDING | AUTO MARKET SHARE MAP |
| MORTGAGE LENDING | CREDIT CARDS | MEMBER BUSINESS LENDING |
| SHARES | INVESTMENTS | MEMBER RELATIONSHIPS |
| EARNINGS | SPECIAL SECTION: CREDIT UNIONS VS. BANKS | |
Auto Market Share Map

Source for all graphs, rankings, and maps unless otherwise noted:Peer-to-Peer Analytics by Callahan & Associates.
| LENDING | AUTO LENDING | AUTO MARKET SHARE MAP |
| MORTGAGE LENDING | CREDIT CARDS | MEMBER BUSINESS LENDING |
| SHARES | INVESTMENTS | MEMBER RELATIONSHIPS |
| EARNINGS | SPECIAL SECTION: CREDIT UNIONS VS. BANKS | |
Mortgage Lending
Not Top Of Mind Yet, But Making Steady Gains
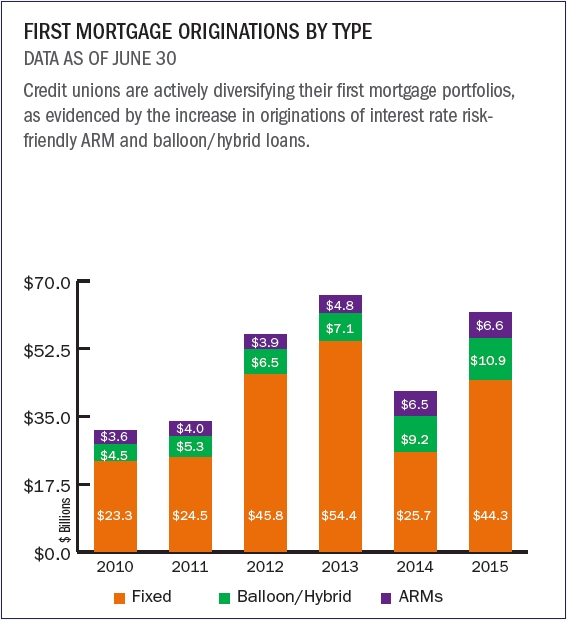
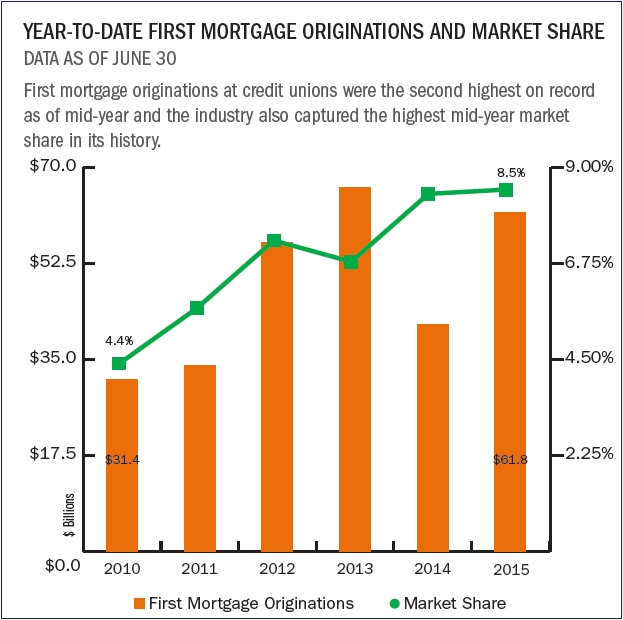
Through the first two quarters of 2015, credit unions originated $61.8 billion in first mortgages, the second-highest year-to-date amount in the industry’s history. Keeping with the uptick in originations, balances of outstanding first mortgages also expanded, growing 10.02% from June 2014 to June 2015. Within the first mortgage portfolio, the proportion of fixed rate products declined slightly year-over-year, falling from 60.6% to 59.3%. Meanwhile, balloon/hybrid and adjustable rate products increased their shares, growing annually by 0.6% and 0.8%, respectively. The asset quality of mortgage products also improved this year. First mortgage delinquency fell 22 basis points between June 2014 and 2015, the largest drop of any loan product, while net charge-offs declined six basis points over the same period.
Click To View Larger
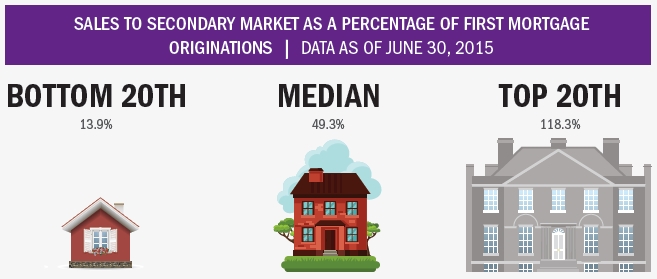
The industry median for sales of first mortgages was 49.3% of total first mortgage originations. On average, credit unions in the bottom 20th percentile sold 13.9% of the first mortgages they originated to the secondary market. Top-selling credit unions reaching the top 20th percentile sold more than they originated, with an average of 118.3%.
Source for all graphs, rankings, and maps unless otherwise noted:Peer-to-Peer Analyticsby Callahan & Associates.
| LENDING | AUTO LENDING | AUTO MARKET SHARE MAP |
| MORTGAGE LENDING | CREDIT CARDS | MEMBER BUSINESS LENDING |
| SHARES | INVESTMENTS | MEMBER RELATIONSHIPS |
| EARNINGS | SPECIAL SECTION: CREDIT UNIONS VS. BANKS | |
Credit Cards
Cooperative Cards Now In Nearly 17 Million Hands
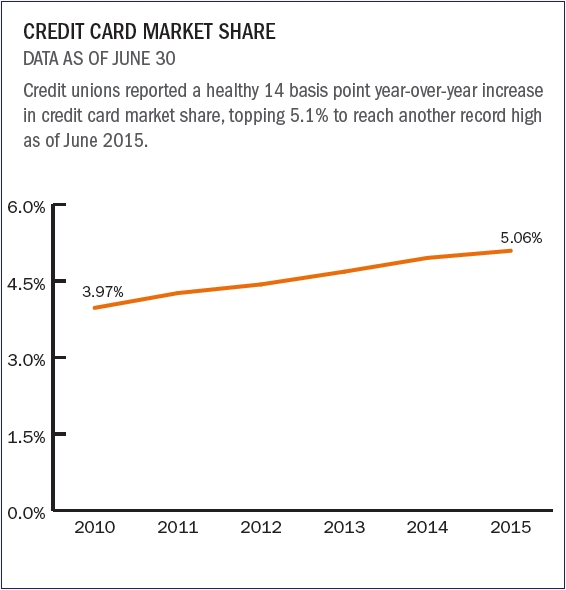
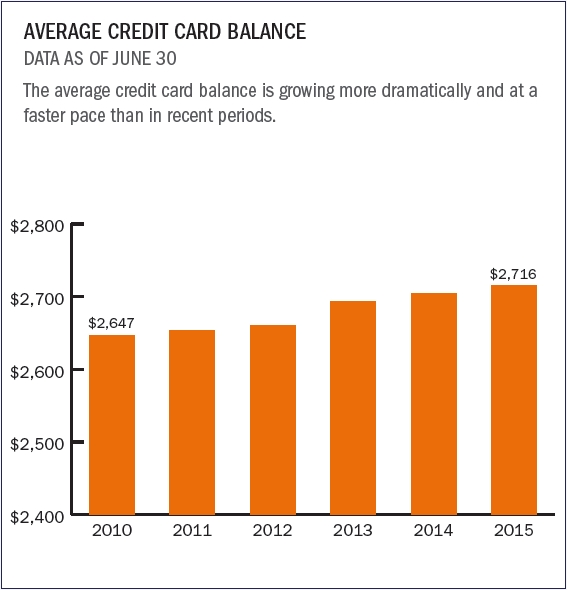
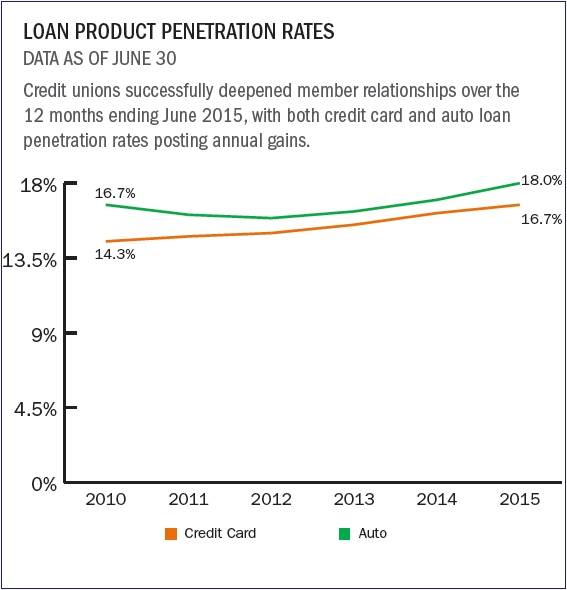
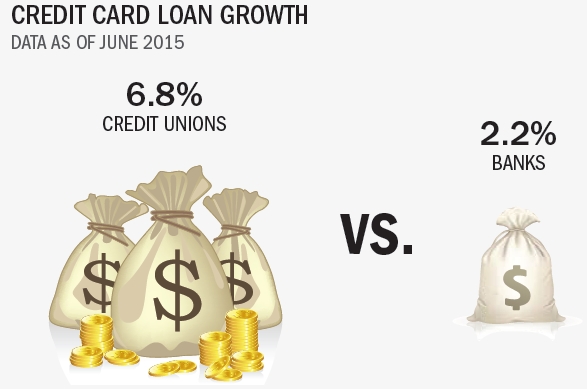
Thanks to rising consumer confidence and increasing demand for credit cards, the number of credit unions offering credit cards has increased. Currently, 58.1% of these organizations offer credit cards to members, with total credit card loan balances topping $46 billion. Overall, the industry has expanded its portfolio by more than $2.9 billion over the past 12 months, representing a 6.8% year-over-year growth. Moreover, the number of cards in circulation reached an all-time high of 17.0 million this quarter, with 1 million new cards added since June 2014.
Click To View Larger
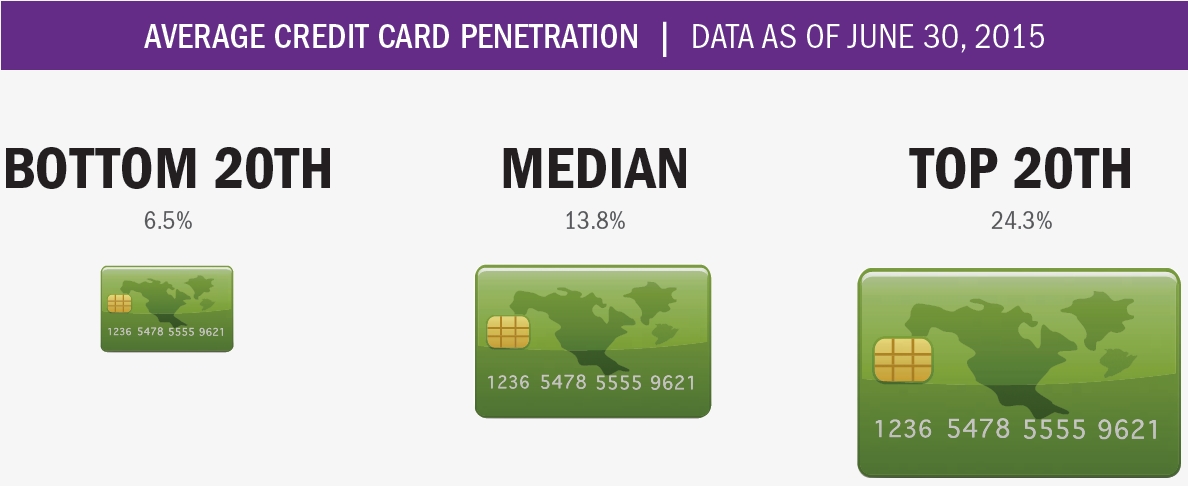
Credit unions in the bottom 20th percentile on average had a 6.5% credit card penetration, while those in the top 20th percentile experienced 24.3% penetration on average. The median credit card penetration rate for the industry was 13.8%. Callahan has excluded the top 5% and bottom 5% to account for outliers and extremes.
Source for all graphs, rankings, and maps unless otherwise noted:Peer-to-Peer Analytics by Callahan & Associates.
| LENDING | AUTO LENDING | AUTO MARKET SHARE MAP |
| MORTGAGE LENDING | CREDIT CARDS | MEMBER BUSINESS LENDING |
| SHARES | INVESTMENTS | MEMBER RELATIONSHIPS |
| EARNINGS | SPECIAL SECTION: CREDIT UNIONS VS. BANKS | |

Member Business Lending
Building An Enterprising Future For All
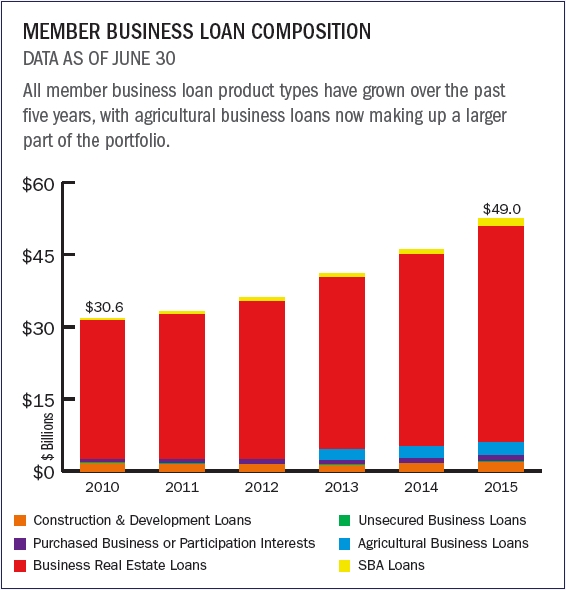
After an annual increase of 12.4%, member business loans outstanding topped $49 billion as of June 2015 and more than one in three credit unions currently hold these loans on their balance sheet. Total MBL originations reached an all-time second quarter high in 2015, with credit unions reporting year-to-date originations of $8.8 billion.

Click To View Larger
Member business loans accounted for 16.8% of total loan originations for credit unions in the top 20th percentile. The median proportion of member business loans to total originations for the industry was 4.5% and in the bottom 20th percentile it was 0.7%.
**This ranking excludes credit unions which reported no originations in the second quarter of 2015.
Source for all graphs, rankings, and maps unless otherwise noted:Peer-to-Peer Analytics by Callahan & Associates.
| LENDING | AUTO LENDING | AUTO MARKET SHARE MAP |
| MORTGAGE LENDING | CREDIT CARDS | MEMBER BUSINESS LENDING |
| SHARES | INVESTMENTS | MEMBER RELATIONSHIPS |
| EARNINGS | SPECIAL SECTION: CREDIT UNIONS VS. BANKS | |
Shares
Closing In On A Major Relationship Milestone
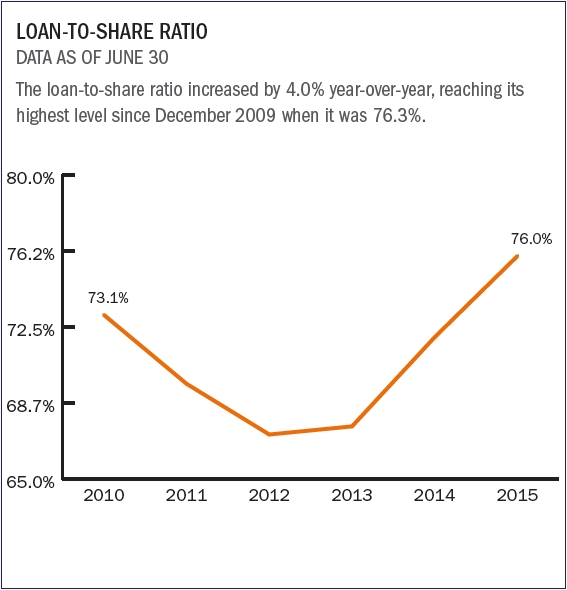
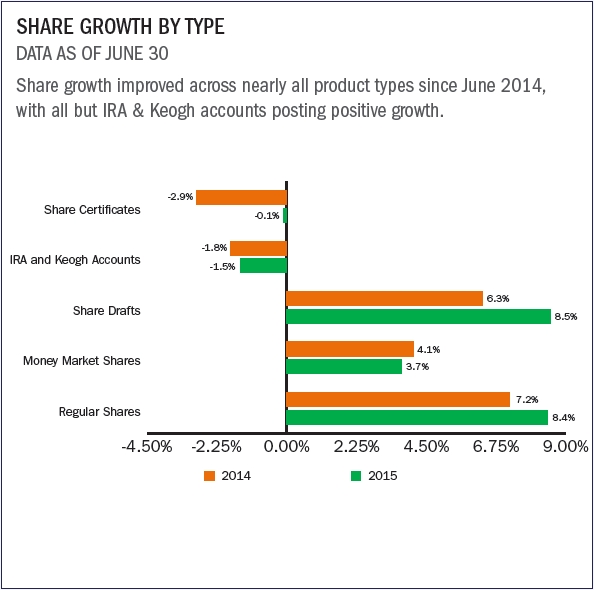
Share balances grew 4.9% to reach nearly $1 trillion in the second quarter of 2015, with non-member deposits accounting for $5.7 billion. The number of share draft accounts also reached a new high of 56 million, with an average share draft balance of $2,490. Strong core deposit growth fueled overall share growth, with core deposits regular shares, share drafts, and money market shares growing 7.6% year-over-year to $716.6 billion.
Click To View Larger
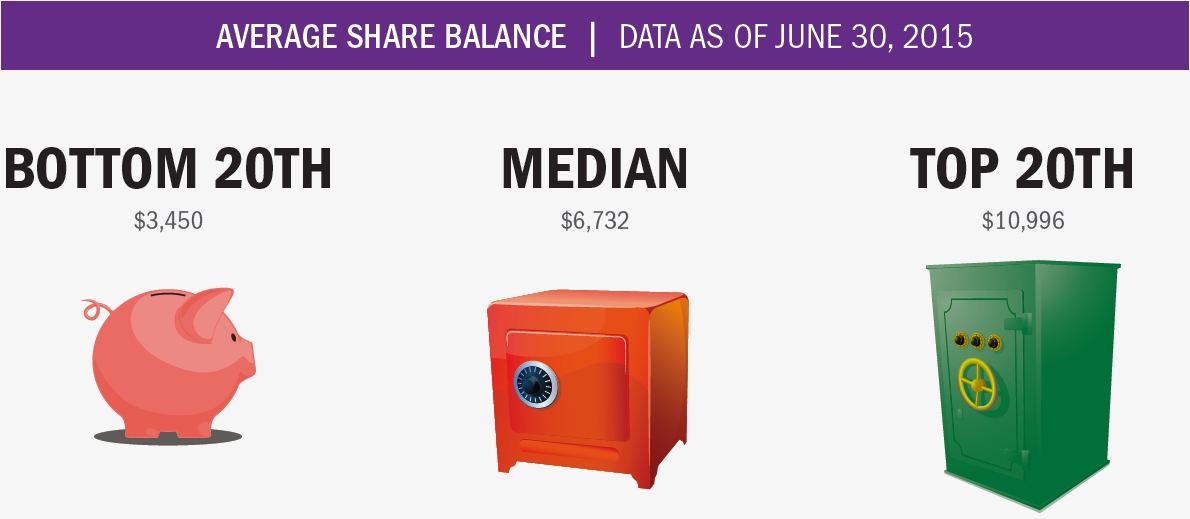
Nationwide, average share balances grew 1.4% year-over-year. Credit unions reaching the top 20th percentile reported an average share balance of $10,996, while those in the middle 50th and bottom 20th percentiles reported $6,732 and $3,450, respectively.
Source for all graphs, rankings, and maps unless otherwise noted:Peer-to-Peer Analytics by Callahan & Associates.
| LENDING | AUTO LENDING | AUTO MARKET SHARE MAP |
| MORTGAGE LENDING | CREDIT CARDS | MEMBER BUSINESS LENDING |
| SHARES | INVESTMENTS | MEMBER RELATIONSHIPS |
| EARNINGS | SPECIAL SECTION: CREDIT UNIONS VS. BANKS | |
Investments
Where Less Was Actually More
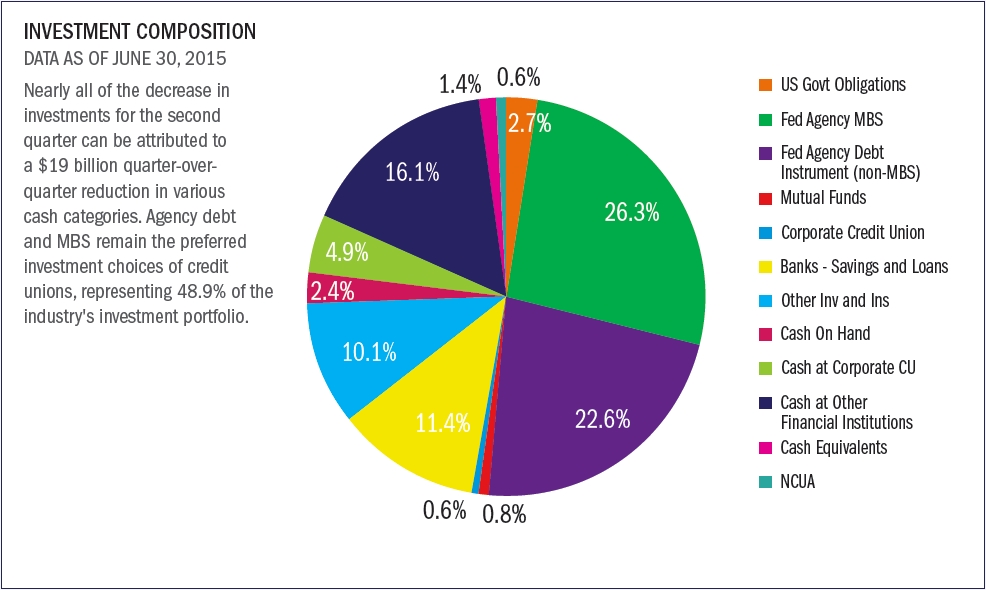
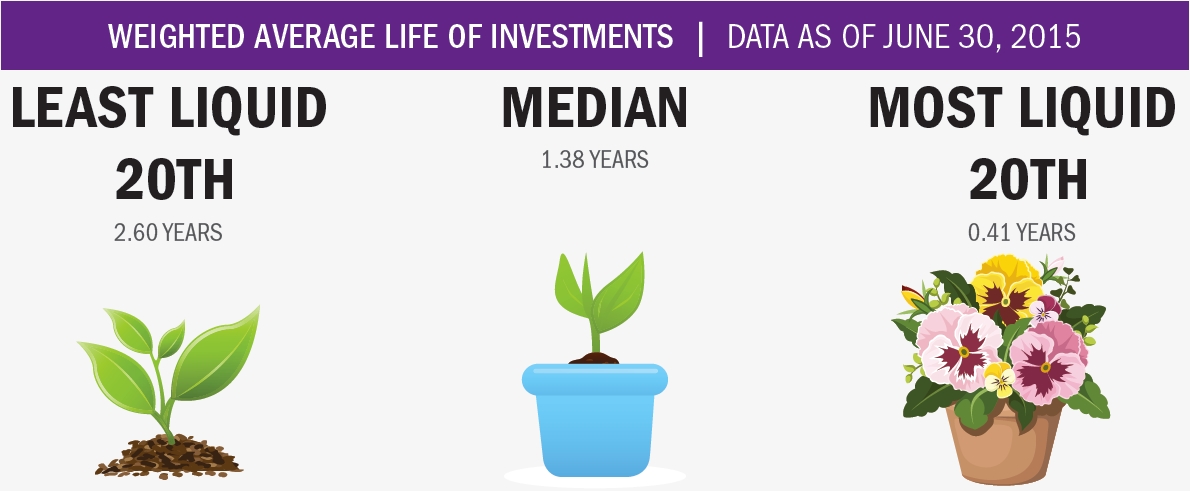
Credit unions held more than $375.8 billion in investments (including cash and cash equivalents) as of June 30, 2015, a decrease of $15.1 billion or 2.9% from the previous quarter’s $387.1 billion. However, the average yield on investments increased slightly, rising to 1.24% from 1.20% in the first quarter. This four-basis-point increase came primarily from lower-yielding cash balances leaving the portfolio, combined with limited new net investment. Drawing down cash balances that were earning 0.25% has helped boost the overall yield of investments.
Click To View Larger
Credit unions have become more liquid, with the industry’s weighted average life of investments dropping 26 basis points to 2.11 years in June 2015. The least liquid credit unions ranking in the bottom 20th percentile reported an average investment life of 2.60 years. By comparison, the industry median is 1.38 years and top-performing credit unions reported an average life of only 0.41 years.
Source for all graphs, rankings, and maps unless otherwise noted:Peer-to-Peer Analytics by Callahan & Associates.
| LENDING | AUTO LENDING | AUTO MARKET SHARE MAP |
| MORTGAGE LENDING | CREDIT CARDS | MEMBER BUSINESS LENDING |
| SHARES | INVESTMENTS | MEMBER RELATIONSHIPS |
| EARNINGS | SPECIAL SECTION: CREDIT UNIONS VS. BANKS | |
Member Relationships
Consumer Flock To A Hospitable, Cooperative Climate
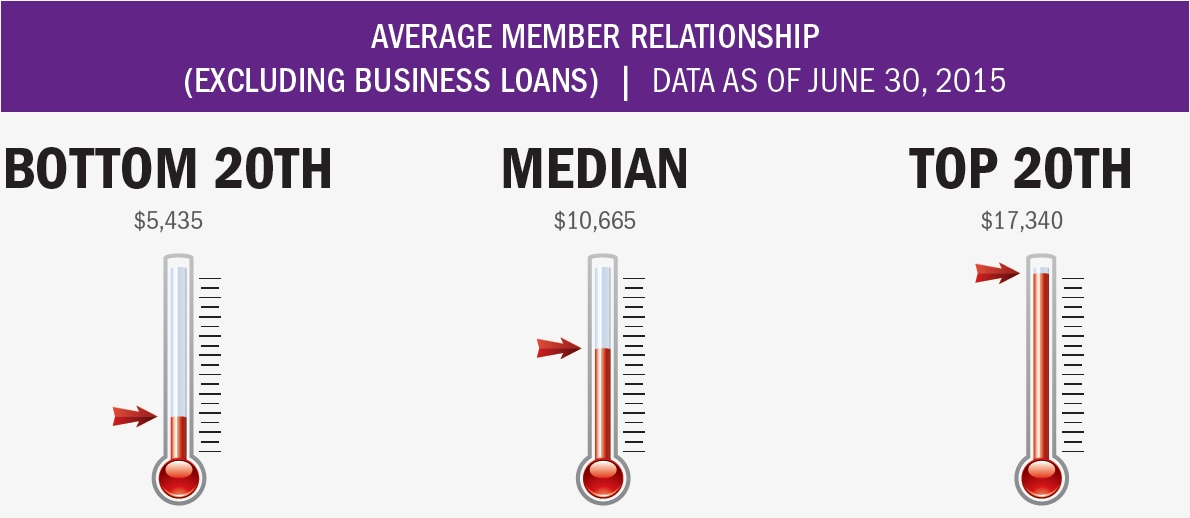
Share draft penetration, a measure of the percentage of members that use a credit union for their day-to-day financial transactions, increased 1.3 percentage points annually to 54.7% as of June 2015. This represents the highest share draft penetration ever recorded. Average member relationships are also up, with the industry average increasing 3.8% year-over-year to $16,605 in June 2015.
Click To View Larger
Credit unions ranking in the bottom 20th percentile reported an average member relationship of $5,435, roughly half the industry median of $10,665. Top-performing credit unions reported an average member relationships of $17,340.
Source for all graphs, rankings, and maps unless otherwise noted:Peer-to-Peer Analytics by Callahan & Associates.
| LENDING | AUTO LENDING | AUTO MARKET SHARE MAP |
| MORTGAGE LENDING | CREDIT CARDS | MEMBER BUSINESS LENDING |
| SHARES | INVESTMENTS | MEMBER RELATIONSHIPS |
| EARNINGS | SPECIAL SECTION: CREDIT UNIONS VS. BANKS | |

Earnings
Home Is Where The Heart Is, And The Money Too.
Underpinned by growth in loan, fee, and other operating income, total income increased 6.7% annually to top $13.2 billion in the first quarter of 2015. Total interest income increased 5.4% annually, driven by strong loan growth which helped to offset a 3.5% annual decline in investment income.
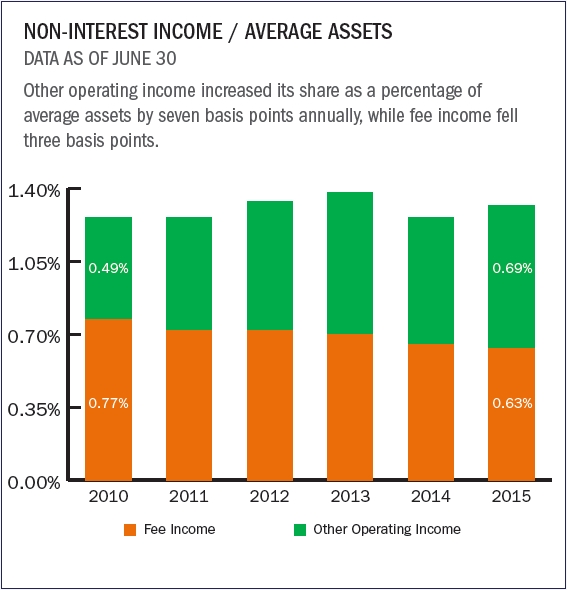
Loan interest income reached $8.5 billion in March 2015, an annual increase of 6.8%, causing the net interest margin to expand by two basis points. Investment income fell to $1.1 billion for the quarter, largely due to the persistent low-rate environment. Meanwhile, total non-interest income rose 10.2% compared to the year prior, with other operating income surging ahead by 18.9% and fee income growing 2.0%.
Other operating income did benefit significantly from sales of mortgages to the secondary market. Credit unions sold $10.1 billion in first mortgages in the first quarter of 2015; that’s an increase of 78.5% from one year ago.
Return on assets was 0.78% through March 2015, two basis points below first quarter 2014 results. As asset growth increased following elevated lending activity, this depressed the effect of a strong 5.8% annual growth in net income, decreasing ROA. However, even with this lower figure, the industry’s net worth ratio still increased by 20 basis points to 10.8%.
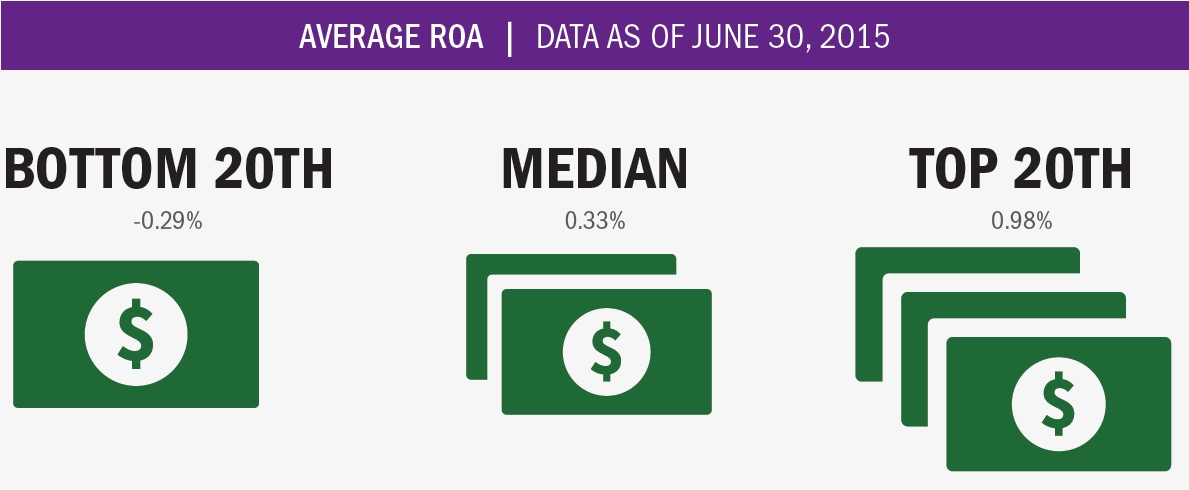
Click To View Larger
Nationwide, ROA remained steady at 0.81% year-over-year. The industry median in was 0.33%. Credit unions ranking in the bottom 20th percentile reported an averge ROA of -0.29% while those in the top 20th percentile reported an average ROA of 0.98%.
Source for all graphs, rankings, and maps unless otherwise noted:Peer-to-Peer Analytics by Callahan & Associates.
| LENDING | AUTO LENDING | AUTO MARKET SHARE MAP |
| MORTGAGE LENDING | CREDIT CARDS | MEMBER BUSINESS LENDING |
| SHARES | INVESTMENTS | MEMBER RELATIONSHIPS |
| EARNINGS | SPECIAL SECTION: CREDIT UNIONS VS. BANKS | |
Special Section: Credit Unions Vs. Banks
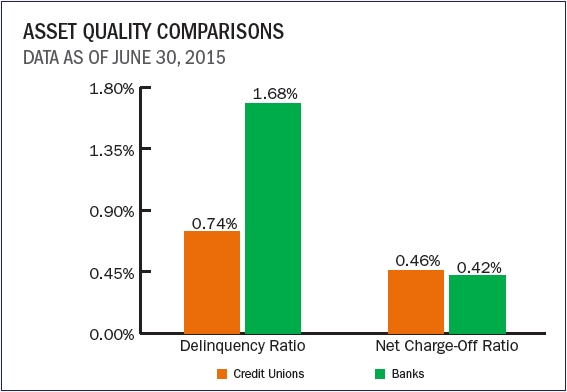
Second quarter data shows cooperative financial institutions outperforming for-profit bank competitors in a variety of performance measures. Where do you stand in this financial services tug of war?
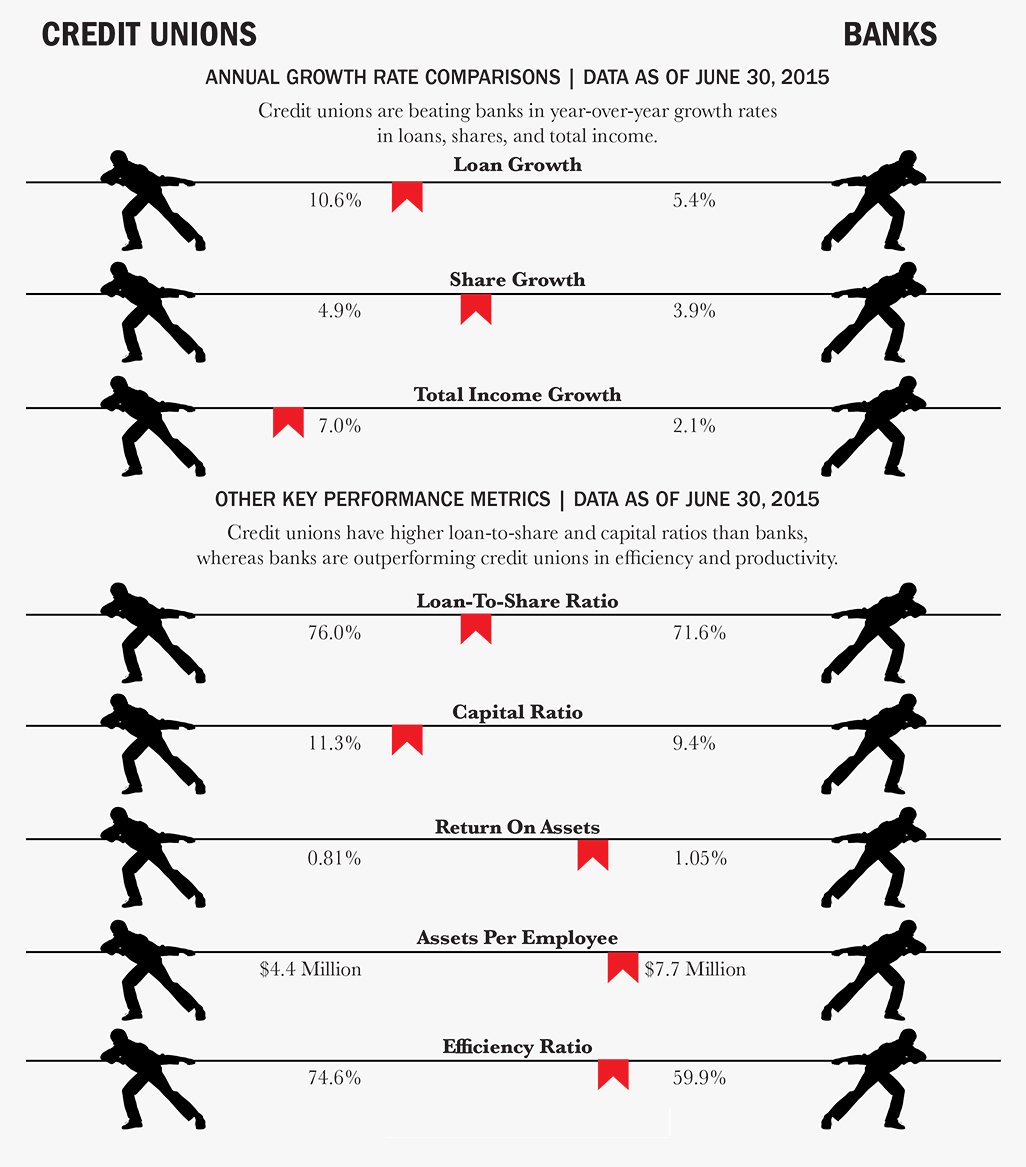
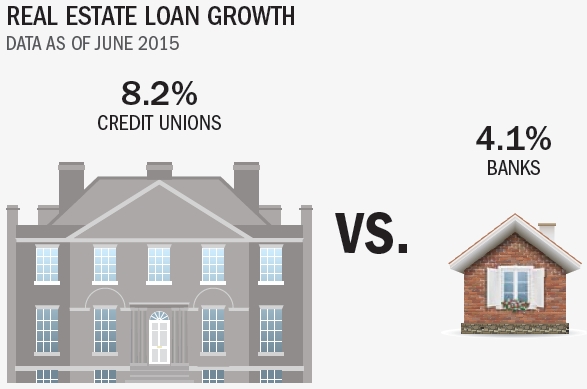
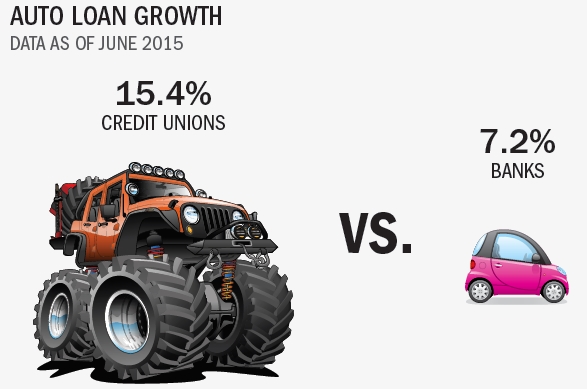
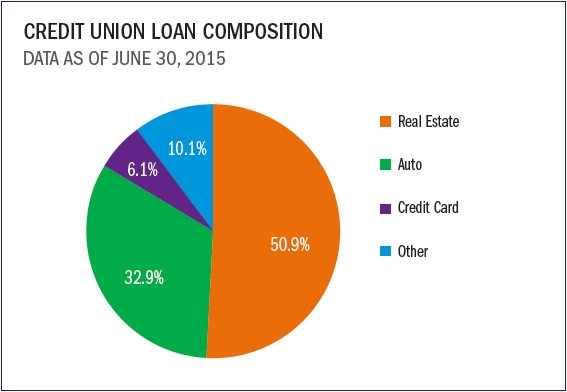
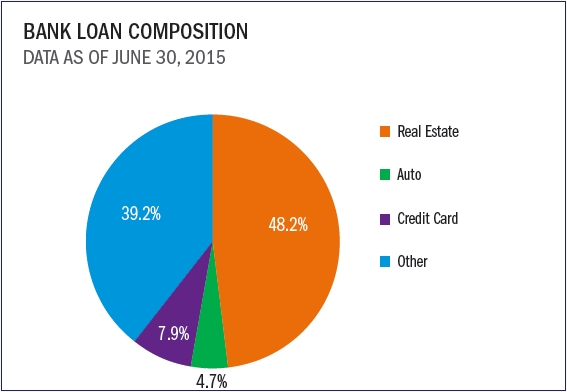
A Comparison Of Product Growth And Concentration Across The Portfolios.
Credit unions auto concentration (32.9%) is seven times that of banks (4.7%) as of June 30, 2015. At banks, commercial and industrials loans, included as other loans in the pie chart, account for 22% of banks entire loan portfolio.
Source for all graphs, rankings, and maps unless otherwise noted:Peer-to-Peer Analytics by Callahan & Associates.