Read the full analysis or skip to the section you want to read by clicking on the links below.
| LENDING | AUTO LENDING | AUTO MARKET SHARE MAP |
| MORTGAGE LENDING | CREDIT CARDS | SHARES |
| MEMBER BUSINESS LENDING | INVESTMENTS | MEMBER RELATIONSHIPS |
| EARNINGS | SPECIAL SECTION: NON-INTEREST INCOME | |
Lending
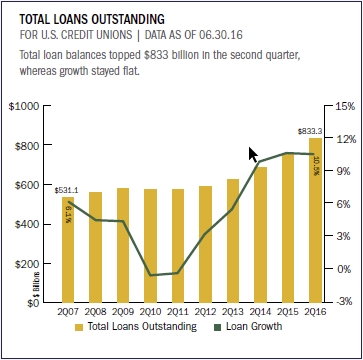
Credit unions originated $218.4 billion in loans in the first six months of 2016. That’s a 9.1% year-over-year increase and an all-time record for the second quarter. Consumer lending increased 11.9%, or $14.0 billion, from second quarter 2015. Other real estate and member business lending also posted significant increases of 13.4% and 16.6%, respectively.
First mortgage origination growth slowed to 1.6%; however, the origination volume of $62.9 billion is the second-largest second quarter amount on record. Second quarter 2013 still holds the record with $66.3 billion originated.
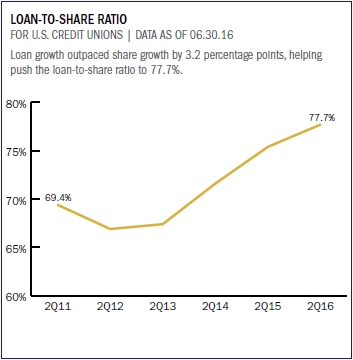
On the balance sheet, outstanding loan growth outpaced deposit growth by 3.2 percentage points, at 10.5% versus 7.3%, driving the loan-to-share ratio 2.2 percentage points higher to 77.7%.
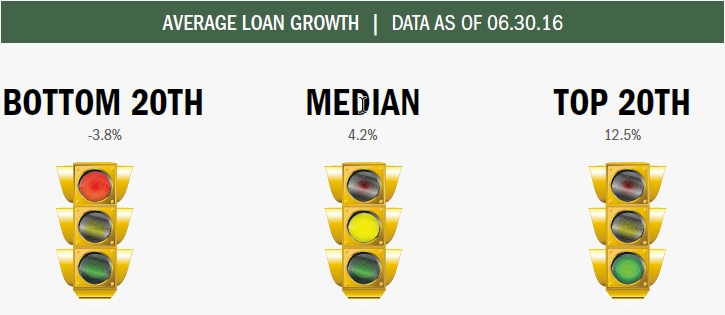
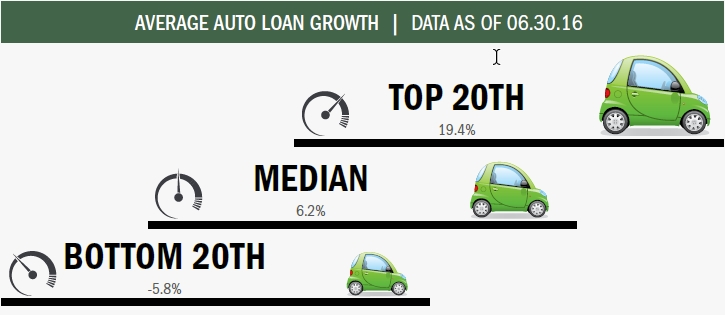
During the second quarter of 2016, the median credit union loan portfolio expanded 4.2% year-over-year. Performers in the top 20th percentile posted 12.5% growth. Credit unions in the bottom 20th percentile posted negative growth of -3.8%.
Source for all graphs, rankings, and maps unless otherwise noted:Peer-to-Peer Analytics by Callahan & Associates.
| LENDING | AUTO LENDING | AUTO MARKET SHARE MAP |
| MORTGAGE LENDING | CREDIT CARDS | SHARES |
| MEMBER BUSINESS LENDING | INVESTMENTS | MEMBER RELATIONSHIPS |
| EARNINGS | SPECIAL SECTION: NON-INTEREST INCOME | |
Auto Lending
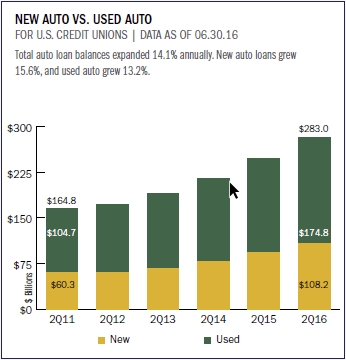
Credit union auto loan balances reached a new high of $282.9 billion in the second quarter of 2016. That’s up 14.1% over second quarter 2015.
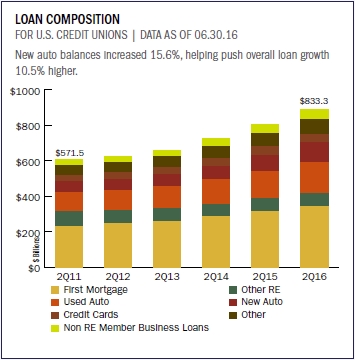
New auto loans increased 15.6% annually, followed by 13.2% for used auto. New and used auto loans have accounted for 44.1% of growth in the total loan portfolio over the past 12 months.
Indirect loans accounted for 53.6% of total auto loans as of June 30, 2016. That’s up 3.0 percentage points from midyear 2015. Although not all indirect lending is from auto loans, approximately 95% of credit unions reporting indirect loan originations use this channel solely for auto lending.
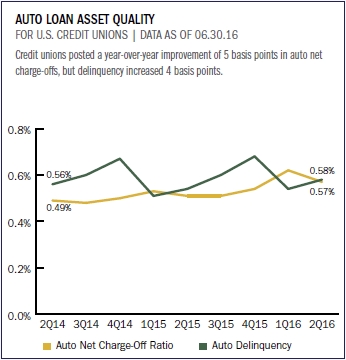
As of midyear 2016, auto delinquency was up 4 basis points from second quarter 2015 to 0.58%.
Auto loan balances hit a new high, reaching nearly $283 billion. New and used auto loans have accounted for 40.4% of growth in the total loan portfolio.
Source for all graphs, rankings, and maps unless otherwise noted:Peer-to-Peer Analytics by Callahan & Associates.
| LENDING | AUTO LENDING | AUTO MARKET SHARE MAP |
| MORTGAGE LENDING | CREDIT CARDS | SHARES |
| MEMBER BUSINESS LENDING | INVESTMENTS | MEMBER RELATIONSHIPS |
| EARNINGS | SPECIAL SECTION: NON-INTEREST INCOME | |
Auto Market Share Map

Source for all graphs, rankings, and maps unless otherwise noted:Peer-to-Peer Analytics by Callahan & Associates.
| LENDING | AUTO LENDING | AUTO MARKET SHARE MAP |
| MORTGAGE LENDING | CREDIT CARDS | SHARES |
| MEMBER BUSINESS LENDING | INVESTMENTS | MEMBER RELATIONSHIPS |
| EARNINGS | SPECIAL SECTION: NON-INTEREST INCOME | |
Mortgage Lending
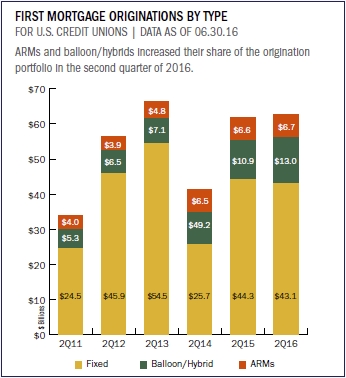
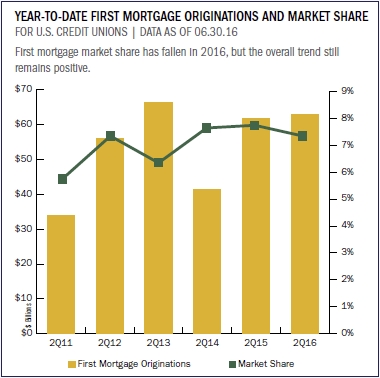
First mortgage originations improved in the second quarter of 2016, albeit at a slower pace than in 2015. First mortgage originations increased 1.6% year-over-year to $62.9 billion that’s the highest six-month balance since the first half of 2013.
Total first mortgages outstanding increased 9.6% or $29.9 billion year-over-year to reach $340.5 billion as of June 30, 2016.
This single-digit growth, however, understates the total mortgage activity occurring within the industry. Credit unions sold 37.6% of their first mortgage originations to the secondary market in the first half of 2016. Credit unions also posted gains in other real estate loans. Those expanded 4.4% year-over-year and added $3.2 billion to the balance sheet, which reached $76.4 billion at midyear.
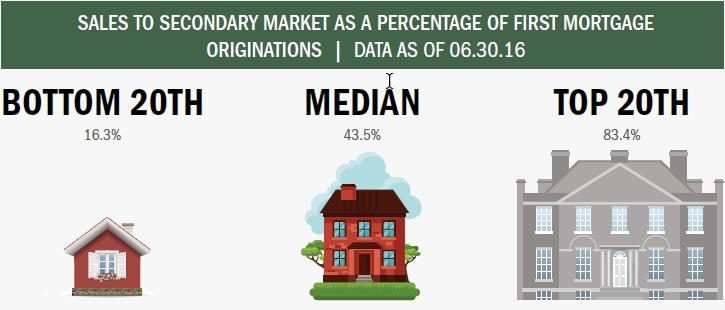
Sales to the secondary market decreased from June 2015 to June 2016, falling 1.3% to $23.6 billion. Credit unions in the bottom 20th percentile sold, on average, 16.3% of their first mortgage loan originations to the secondary market. The industry median for sales to the secondary market was 43.5%. Credit unions in the upper 20th percentile sold 83.4% on average.
Source for all graphs, rankings, and maps unless otherwise noted:Peer-to-Peer Analytics by Callahan & Associates.
| LENDING | AUTO LENDING | AUTO MARKET SHARE MAP |
| MORTGAGE LENDING | CREDIT CARDS | SHARES |
| MEMBER BUSINESS LENDING | INVESTMENTS | MEMBER RELATIONSHIPS |
| EARNINGS | SPECIAL SECTION: NON-INTEREST INCOME | |
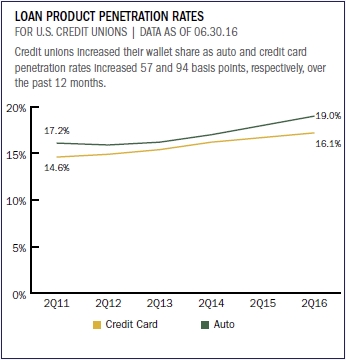
Credit Cards
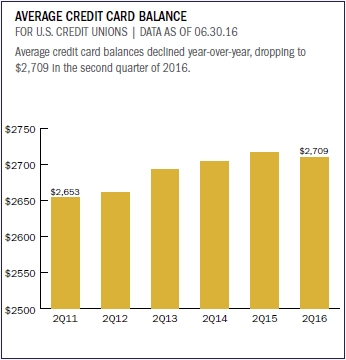
Credit union credit card balances topped $49.6 billion in June 2016. That’s an annual increase of $3.3 billion. This is a reflection of a strengthening economy and increased consumer spending.
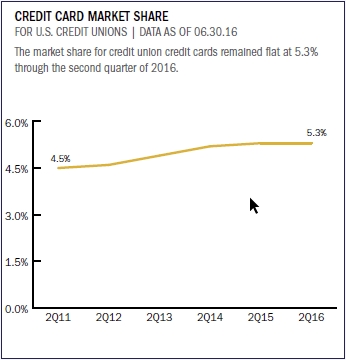
As of June 30, 2016, 59.6% of credit unions held credit card loans on their book. That’s up 1.5 percentage points from June 2015. Credit cards comprised 6.0% of total loans at the end of the second quarter down from 6.1% one year ago thanks partly to slower growth compared to other loan products such as first mortgages and auto loans, which expanded 9.6% and 14.1%, respectively, over the same period.
![]()
Compare. Learn. Excel.
With Callahan’s Peer-to-Peer, it’s easy to analyze a credit union’s credit card portfolio and strategy by comparing balance growth, penetration rates, and credit card usage. Start today!
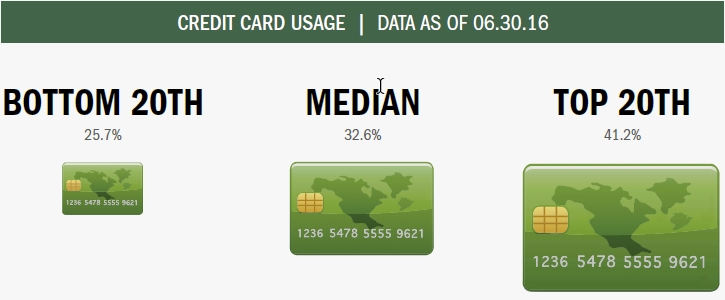
Credit card usage across all three usage percentiles declined slightly from previous midyear levels of 26.1%, 33.1%, and 41.4%.
Source for all graphs, rankings, and maps unless otherwise noted:Peer-to-Peer Analytics by Callahan & Associates.
| LENDING | AUTO LENDING | AUTO MARKET SHARE MAP |
| MORTGAGE LENDING | CREDIT CARDS | SHARES |
| MEMBER BUSINESS LENDING | INVESTMENTS | MEMBER RELATIONSHIPS |
| EARNINGS | SPECIAL SECTION: NON-INTEREST INCOME | |
Shares
Credit union members added $73.2 billion in share balances over the past 12 months. Share balances neared $1.1 trillion at midyear, a 7.3% year-over-year increase.
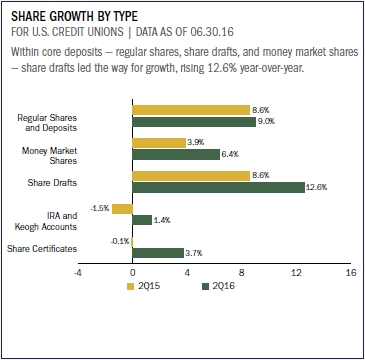
Core deposits which include regular shares, money market shares, and share drafts accounted for the bulk of share growth. With 12.6% year-over-year growth, share draft balances increased at the fastest pace and reached $157.0 billion as of June 30, 2016.
Despite a continued low interest rate environment, longer-term savings options have begun to rebound over the past year. Members aren’t as hesitant to lock up funds, and, as a result, IRA/Keogh balances increased 1.4% over second quarter 2015 while share certificate balances increased 3.7% over the same period.
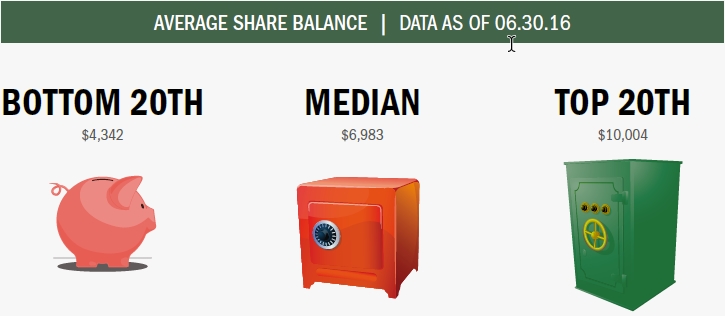
The average share balance for the industry increased 3.2% year-over-year. Credit unions in the top 20th percentile reported an average share balance of $10,004. Those in the middle 50th and bottom 20th percentiles reported average balances of $6,983 and $4,342, respectively.
Source for all graphs, rankings, and maps unless otherwise noted:Peer-to-Peer Analytics by Callahan & Associates.
| LENDING | AUTO LENDING | AUTO MARKET SHARE MAP |
| MORTGAGE LENDING | CREDIT CARDS | SHARES |
| MEMBER BUSINESS LENDING | INVESTMENTS | MEMBER RELATIONSHIPS |
| EARNINGS | SPECIAL SECTION: NON-INTEREST INCOME | |
Member Business Lending
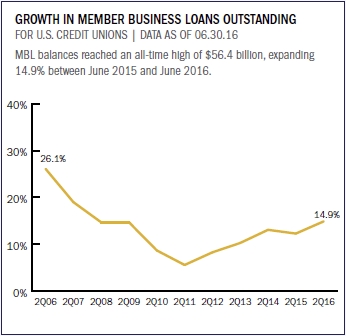
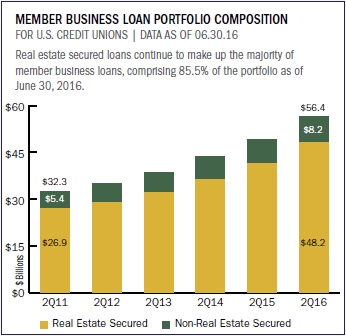
Credit unions across the country have added $7.3 billion in member business loans since the second quarter of 2015, and MBL balances hit $56.4 billion at midyear 2016.
Average MBL balances per credit union topped $9.4 million that’s a 20.2% increase over second quarter 2015.
Growth also accelerated in the second quarter of 2016. Credit unions posted 14.9% growth in the MBL portfolio, up 2.6 percentage points from the previous year-over-year rate of 12.3%. By comparison, the total loan portfolio has increased 10.5% year-over-year.
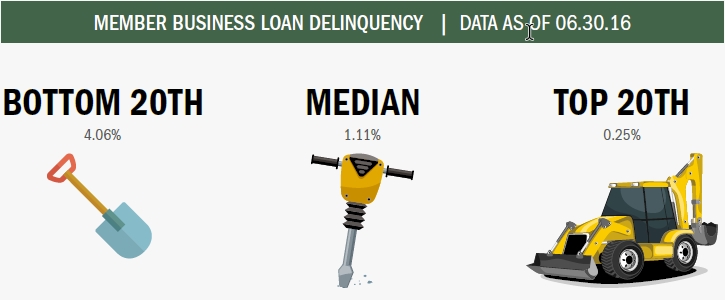
The median MBL delinquency reached 1.11%. That’s more than 3.0 percentage points lower than credit unions in the bottom 20th percentile, which reported 4.06% delinquency. Credit unions in the top 20th percentile reported an MBL delinquency rate of 0.25%.
Source for all graphs, rankings, and maps unless otherwise noted:Peer-to-Peer Analytics by Callahan & Associates.
| LENDING | AUTO LENDING | AUTO MARKET SHARE MAP |
| MORTGAGE LENDING | CREDIT CARDS | SHARES |
| MEMBER BUSINESS LENDING | INVESTMENTS | MEMBER RELATIONSHIPS |
| EARNINGS | SPECIAL SECTION: NON-INTEREST INCOME | |
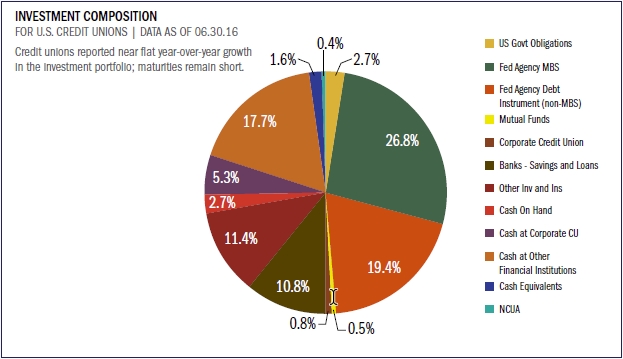
Investments
Credit unions held more than $378.3 billion in investments, including cash and cash equivalents, as of June 30, 2016. That’s a decrease of $12.8 billion or 3.3% from the first quarter’s $391.1 billion.
The average yield on investments, however, has increased slightly to 1.35% from 1.31% in the first quarter. This 4-basis-point increase is primarily the result of lower-yielding cash balances leaving the portfolio and limited new net investment.
The average investment maturity for credit unions shortened in the second quarter. The largest increase in maturity was in securities, where maturities of less than one year increased 5.4%. Securities longer than three years all posted declines of varying degrees.
With strong lending and speculation about a possible increase from the Fed this year, credit unions are remaining short.

The median yield on average investments stood at 1.06% at the end of second quarter. That’s up 7 basis points from one year ago. Credit unions ranked in the top 20th percentile reported an investment yield of 1.40% versus 0.68% for those in the bottom 20th.
Source for all graphs, rankings, and maps unless otherwise noted:Peer-to-Peer Analytics by Callahan & Associates.
| LENDING | AUTO LENDING | AUTO MARKET SHARE MAP |
| MORTGAGE LENDING | CREDIT CARDS | SHARES |
| MEMBER BUSINESS LENDING | INVESTMENTS | MEMBER RELATIONSHIPS |
| EARNINGS | SPECIAL SECTION: NON-INTEREST INCOME | |
Member Relationships
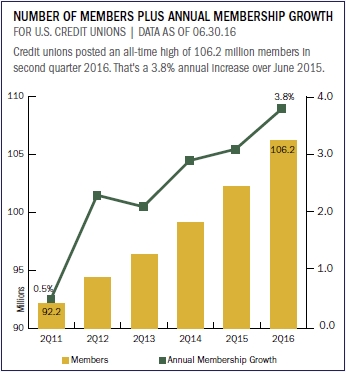
Credit union membership has increased 3.8% since second quarter 2015, and the industry now serves a record 106.2 million members.
Credit unions also posted a new record in average member relationships, which reached $17,350 at midyear. Core deposits which include money market accounts, share drafts and regular shares have doubled over the past 10 years.
Additionally, penetration rates were up year-over-year across all major products. As of second quarter 2016, penetration rates stood at 17.2% for credit cards, 4.4% for real estate, 55.5% for share draft, and 19.0% for auto loans.
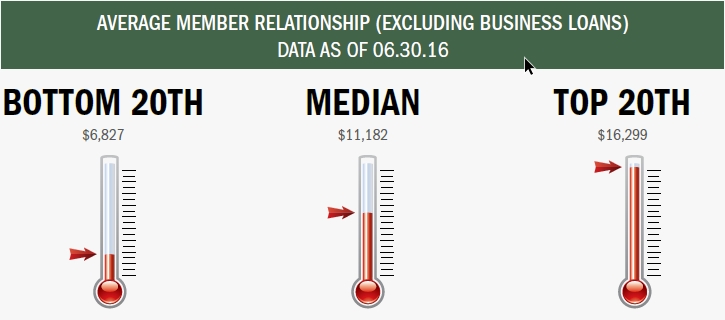
Top-performing credit unions posted an average member relationship of $16,299 as of June 2016 $5,117 above the median. Credit unions reporting in the bottom 20% have an average member relationship of $6,827.
Source for all graphs, rankings, and maps unless otherwise noted:Peer-to-Peer Analytics by Callahan & Associates.
| LENDING | AUTO LENDING | AUTO MARKET SHARE MAP |
| MORTGAGE LENDING | CREDIT CARDS | SHARES |
| MEMBER BUSINESS LENDING | INVESTMENTS | MEMBER RELATIONSHIPS |
| EARNINGS | SPECIAL SECTION: NON-INTEREST INCOME | |
Earnings
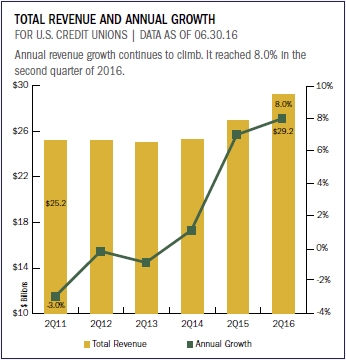
Total revenue for all credit unions topped $29 billion in the second half of 2016 as the industry worked to satisfy member demand for a range of loan products.
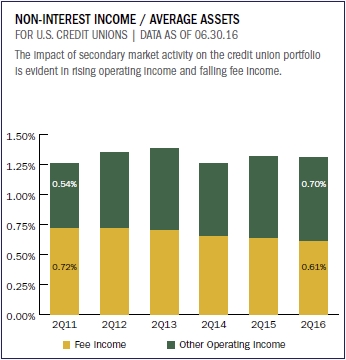
Interest income was largely responsible for the industry’s 8.0% year-over-year revenue growth; however, a 6.0% annual increase in non-interest income also contributed to the rise in total revenue. Non-interest income and interest income reached $21.1 billion and $8.4 billion, respectively, through June 30, 2016.
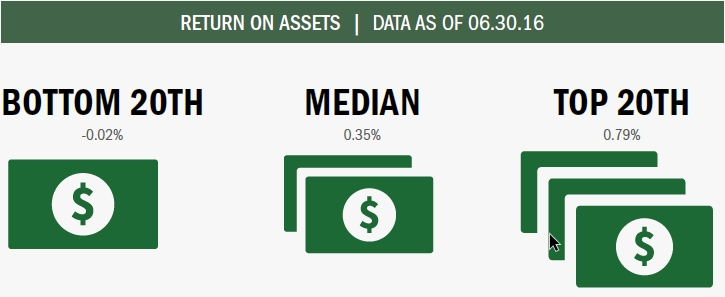
ROA fell 3 basis points year-over-year as asset growth outpaced net income growth. The industry median in June 2016 was 0.35%. Credit unions ranking in the bottom 20th percentile remained flat at -0.02% while those in the top 20th percentile gained 2 basis points to reach 0.79% ROA.
Source for all graphs, rankings, and maps unless otherwise noted:Peer-to-Peer Analytics by Callahan & Associates.
| LENDING | AUTO LENDING | AUTO MARKET SHARE MAP |
| MORTGAGE LENDING | CREDIT CARDS | SHARES |
| MEMBER BUSINESS LENDING | INVESTMENTS | MEMBER RELATIONSHIPS |
| EARNINGS | SPECIAL SECTION: NON-INTEREST INCOME | |
Special Section: Non-Interest Income
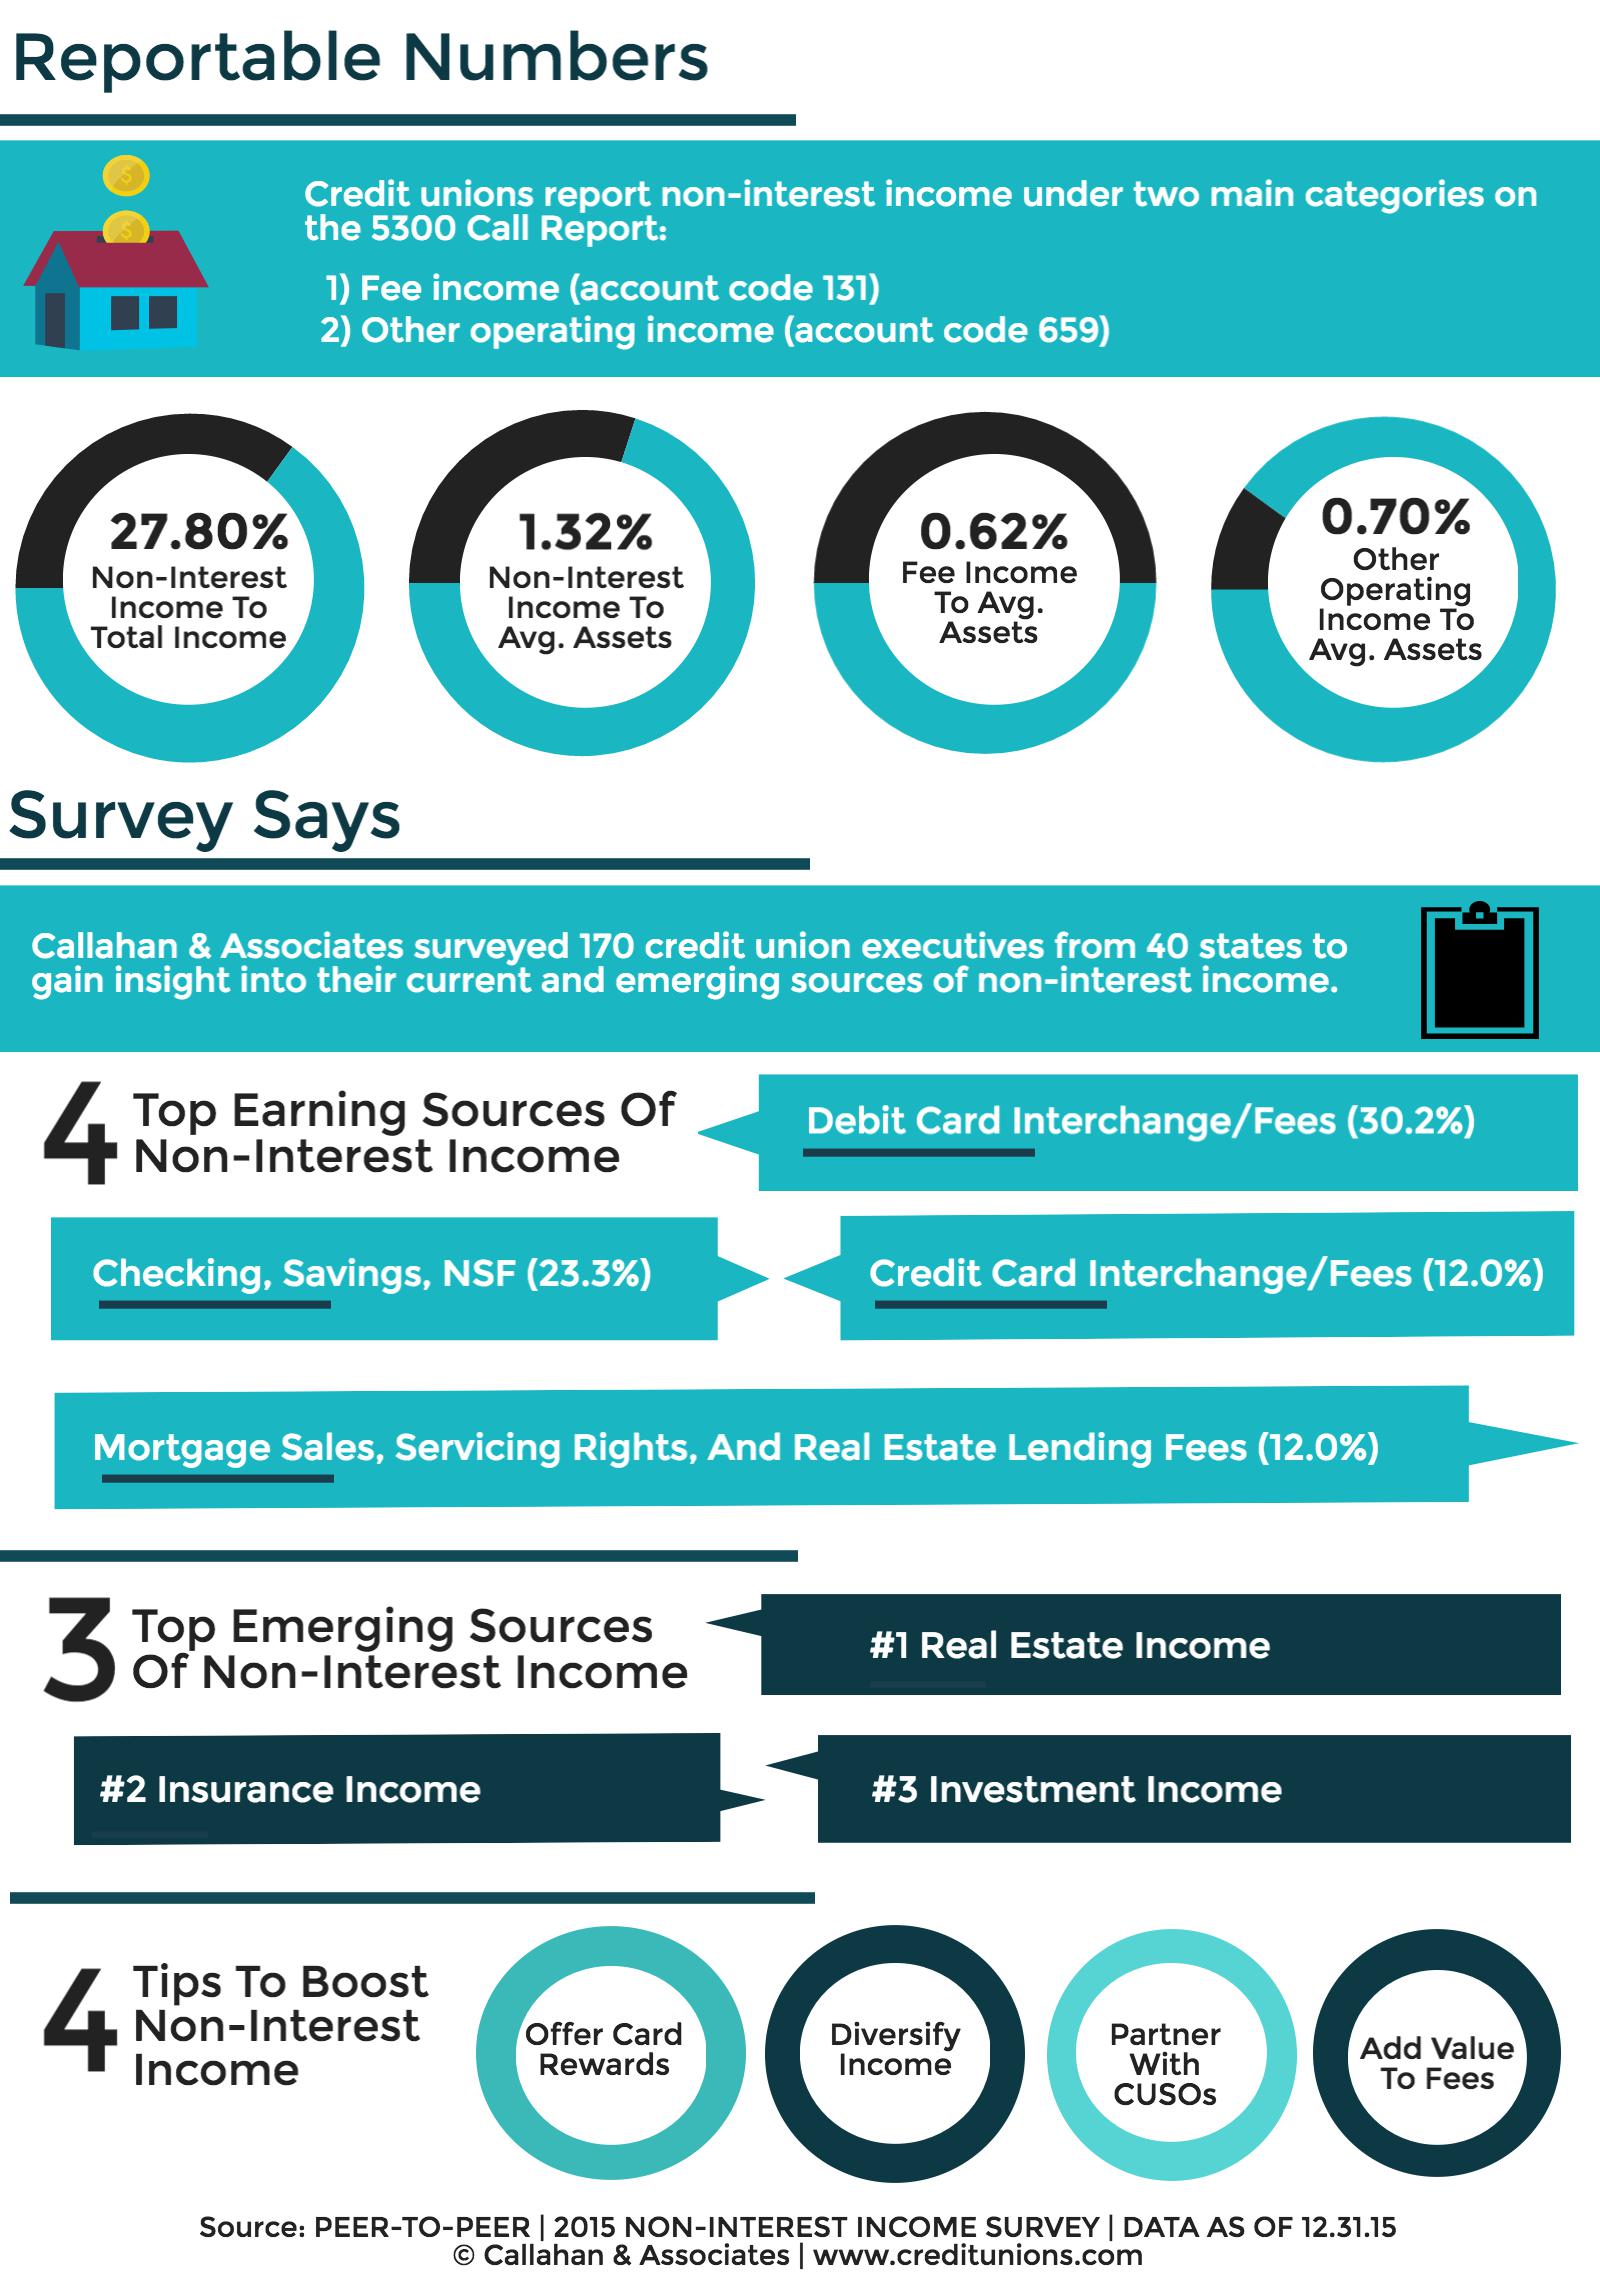
Source for all graphs, rankings, and maps unless otherwise noted:Peer-to-Peer Analytics by Callahan