Read the full analysis or skip to the section you want to read by clicking on the links below.
| LENDING | AUTO LENDING | MORTGAGE LENDING |
| CREDIT CARDS | SHARES | INVESTMENTS |
| MEMBER RELATIONSHIPS | EARNINGS | RISK-BASED CAPITAL |

LENDING
12 months of breaking records and changing lives.
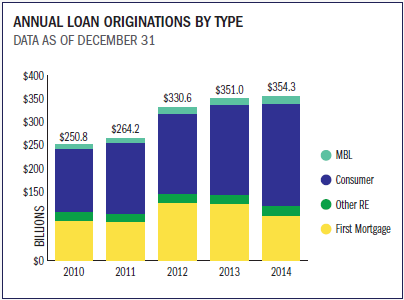
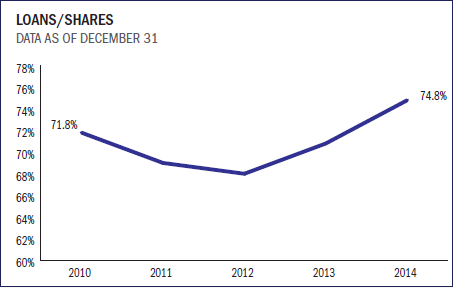
Credit unions lent $354.3 billion in loans throughout 2014. That’s a new record that surpassed last year’s volume by 0.9%. With this increase in originations, outstanding loan growth was more than double the rate of share growth 10.4% versus 4.5%. As a result, the loan-to-share ratio which measures to what degree credit unions are lent out finally reached a level in line with pre-recession norms. Increased lending activity also generated a 4.4% annual uptick in loan interest income for credit unions.
Hover over image to enlarge
For All U.S. Credit Unions
Source for all images unless otherwise noted:
Peer-to-Peer Analytics by Callahan & Associates
A 4.3% increase in U.S. personal consumption expenditures in the fourth quarter of 2014 indicates that members are finally comfortable saving less and spending more. This trend is mirrored in credit union consumer loan origination levels, including auto, credit cards, and more. These grew 14.2% over 2013 to reach $220.4 billion in 2014. Auto lending in particular continued to be a star performer, with outstanding new auto loans growing 20.9% annually and used auto loans growing 12.9%.
26.5M
The number of loans made to members in 2014, up from 24.3 million in 2013.
2x
Loans are growing over two times faster than shares as of December 2014.
| LENDING | AUTO LENDING | MORTGAGE LENDING |
| CREDIT CARDS | SHARES | INVESTMENTS |
| MEMBER RELATIONSHIPS | EARNINGS | RISK-BASED CAPITAL |
AUTO LENDING
Auto lending was the year’s can’t-miss opportunity.
Hover over image to enlarge
For All U.S. Credit Unions
Source for all images unless otherwise noted:
Peer-to-Peer Analytics by Callahan & Associates
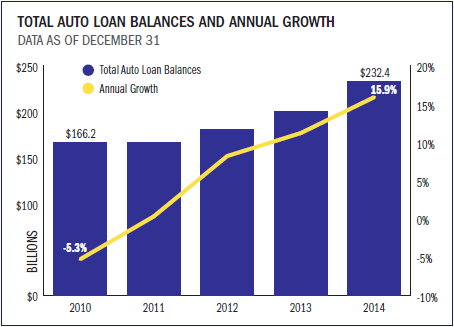
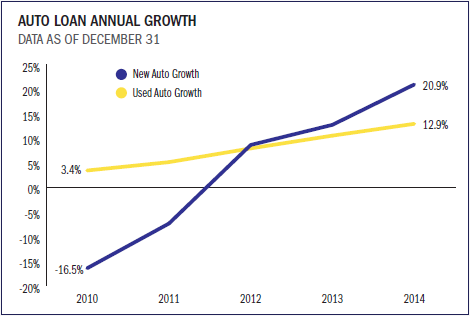
Auto sales took off in 2014, with 16.5 million cars sold during the year. That’s an increase of nearly 6% from 2013 and the highest total since 2006. Few credit unions let that opportunity pass by.
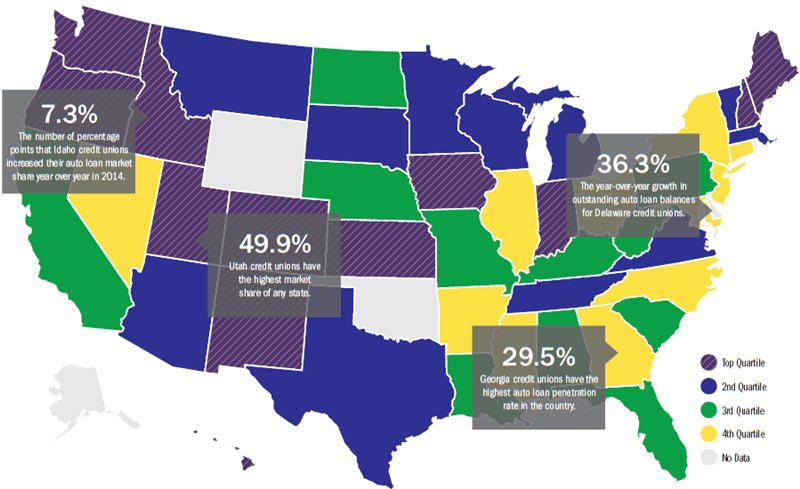
As of December 2014, the industry reported new auto loan growth of 20.9% and used auto loan growth of 12.9%. That’s up from 12.7% and 10.5%, respectively, in 2013. Market share also increased to 16.3% in 2014. That’s a bump of 1.3 percentage points from the year prior.
New auto lending was the fastest-growing segment of the loan portfolio in 2014; used auto loan growth came in third behind business loans. With analysts anticipating 17 million vehicle sales in 2015 and as many as 20 million in annual sales by 2018, auto lending should continue to be a boon to credit unions for years to come.
Auto Loan Originations: 1.5M
The number of new and used auto loans added to the books of credit unions in 2014.
Source: Callahan & Associates
2013: 15.0% vs. 2014: 16.3%
The industry’s market share for auto loan originations increased 1.3 percentage points in 2014.
Source: Autocount Data From Experian Automotive; Callahan & Associates
2014 YTD Credit Union Auto Loan Origination Market Share By State
For all U.S. credit unions | Data as of Dec. 31
Callahan & Associates | www.creditunions.com
Click to view full-size map.
Source: Autocount Data From Experian Automotive
| LENDING | AUTO LENDING | MORTGAGE LENDING |
| CREDIT CARDS | SHARES | INVESTMENTS |
| MEMBER RELATIONSHIPS | EARNINGS | RISK-BASED CAPITAL |
Hover over image to enlarge
For All U.S. Credit Unions
Source for all images unless otherwise noted:
Peer-to-Peer Analytics by Callahan & Associates
MORTGAGE LENDING
The refi boom busted, but overall market share made gains.
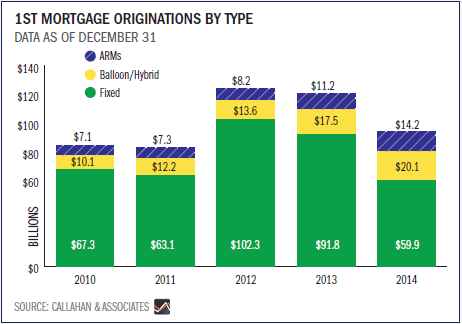
Credit unions originated $94.3 billion in mortgages in 2014. Adjustable rate and hybrid mortgages were popular options that comprised approximately 36.5% of total first mortgage originations in the fourth quarter compared to as little as 17.6% in 2012.
Despite successes with ARMs and hybrids, overall credit union mortgage origination activity was down 21.2% from the $119.6 billion originated in 2013. This decrease was largely the result of diminished refinancing activity and was still less than half the 39% decline seen in the overall mortgage market. As such, credit unions actually increased their market share here.
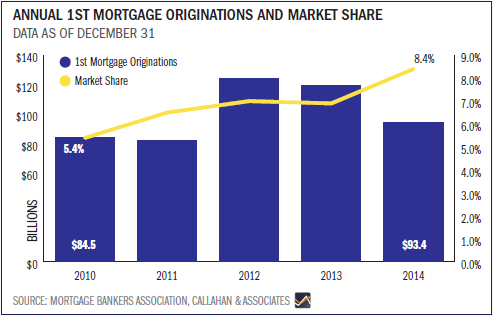
In 2014, more home shoppers made a credit union their institution of choice for mortgage financing, a potential signal of gains made in the battle over consumer awareness. The cooperative industry accounted for 8.4% of all U.S. mortgage originations, according to the Mortgage Bankers Association. This is much improved from the 6.9% market share captured in 2013 and nearly double the 4.5% market share held in 2009. Credit unions held more mortgages on their balance sheets in 2014, as evidenced by annual outstanding first mortgage loan growth of 9.1% compared to 8.7% the previous year.
| Rank | State | Credit Union* | Annual Growth In 1st Mortgage Originations | 2014 1st Mortgage Originations | 2013 1st Mortgage Originations | Total Assets |
|---|---|---|---|---|---|---|
| 1 | SC | CPM | 571.4% | $7,572,610 | $1,127,900 | $294,694,082 |
| 2 | WI | People’s Choice | 375.8% | $6,360,316 | $1,336,835 | $28,557,160 |
| 3 | PA | Tri County Area | 372.5% | $6,949,142 | $1,470,600 | $109,961,174 |
| 4 | MO | CU Community | 315.8% | $12,012,073 | $2,888,601 | $95,451,977 |
| 5 | PA | Butler Armco Employees | 313.7% | $13,082,244 | $3,162,601 | $289,673,597 |
| 6 | TX | Communities of Abilene | 280.8% | $4,183,521 | $1,098,489 | $128,628,601 |
| 7 | WY | Trona Valley Community | 268.7% | $16,852,627 | $4,570,733 | $164,083,159 |
| 8 | IL | Community Trust | 252.5% | $13,522,199 | $3,836,316 | $191,784,102 |
| 9 | NY | Family First | 248.2% | $36,839,059 | $10,580,715 | $156,693,377 |
| 10 | CT | General Electric Employees | 244.5% | $15,512,500 | $4,503,002 | $178,122,342 |
*Excludes credit unions with less than 50 originations in 2014 and 10 in 2013.
| LENDING | AUTO LENDING | MORTGAGE LENDING |
| CREDIT CARDS | SHARES | INVESTMENTS |
| MEMBER RELATIONSHIPS | EARNINGS | RISK-BASED CAPITAL |

CREDIT CARDS
Cards kept shining despite evolution in the payments space.
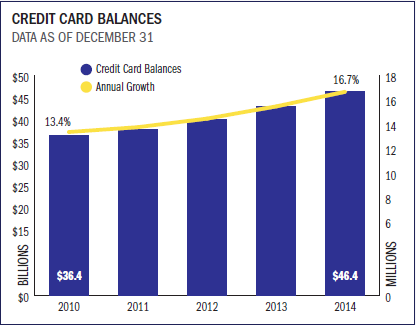
Credit unions posted multiple credit card records in 2014 despite interloping competitors and growing uncertainty in that area of the market. Balances totaled $46.4 billion at year-end, marking an annual growth rate 7.9% that is the fastest since the fourth quarter of 2008.
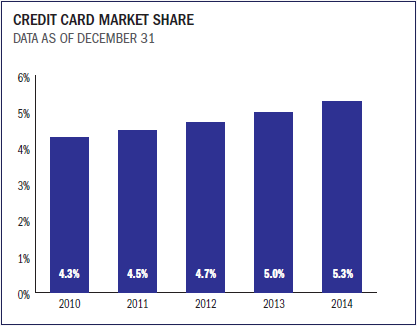
In addition, credit unions issued 1.1 million credit cards in 2014, representing a 7.3% annual increase. This outpaced the 3.1% annual growth in membership, which led to credit card penetration hitting a new high-water mark of 16.6%. Total market share also increased 30 basis points to 5.3% last year.
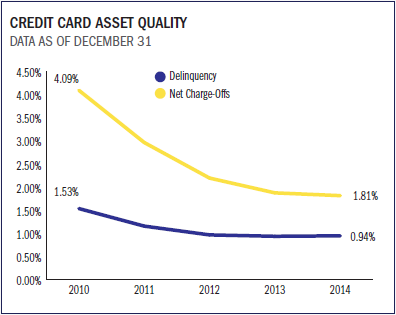
Growth in credit cards, however, did not diminish asset quality. In fact, asset quality improved. As of December 2014, the credit card delinquency rate and net charge-off ratio stood at 0.94% and 1.81%, respectively. That’s a significant drop from the 2.02% and 4.15% reported five year ago during the depths of the recession.
Finally, card programs managed in-house became more prevalent among credit unions in 2014. At year-end 2014, more than 57.6% of the industry offered a credit card program to members, up from 56.3% at the end of 2013.
|
|
|
| LENDING | AUTO LENDING | MORTGAGE LENDING |
| CREDIT CARDS | SHARES | INVESTMENTS |
| MEMBER RELATIONSHIPS | EARNINGS | RISK-BASED CAPITAL |
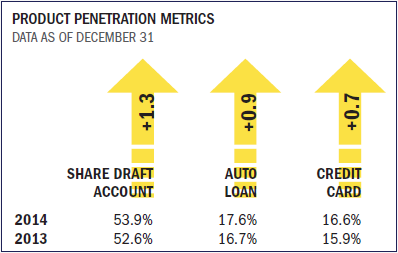
SHARES
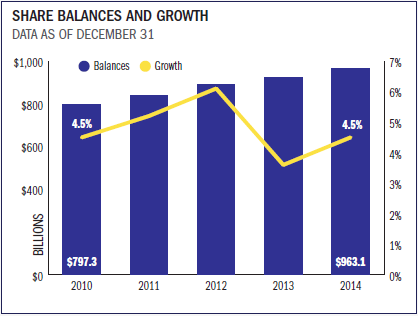
Consumers shifted their attention, but credit unions still made share progress.
2.9M
The increase in the number of share draft accounts at credit unions between December 2013 and December 2014.
|
|
|
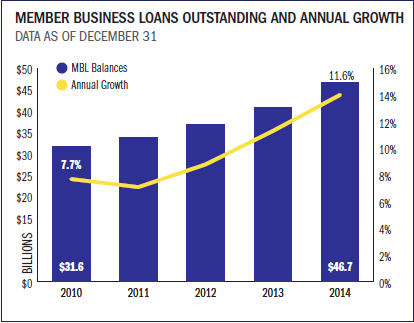
MEMBER BUSINESS LOANS
Expanded expertise helped MBL make double-digit strides.
213,453
The number of outstanding member business loans as of year end 2014.
|
|
|
| LENDING | AUTO LENDING | MORTGAGE LENDING |
| CREDIT CARDS | SHARES | INVESTMENTS |
| MEMBER RELATIONSHIPS | EARNINGS | RISK-BASED CAPITAL |
INVESTMENTS
Credit unions invested less and made more.
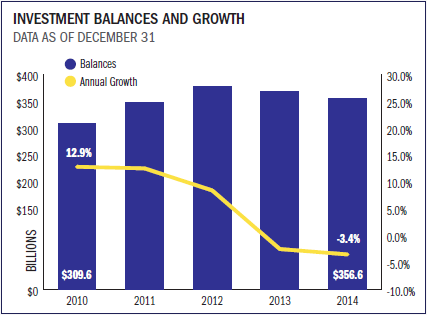
Accelerating loan growth suppressed total investment balances, including cash. Investment balances declined 3.4% annually, dropping from $369.0 billion at year-end 2013 to $356.6 billion at the close of 2014.
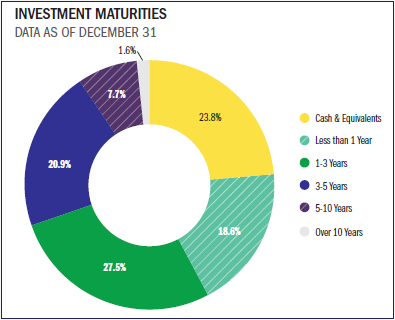
Many credit unions remained more liquid to meet surging loan demand. As such, investments maturing between one and three years comprised the largest portion of the industry’s portfolio 27.5% of total investments. That’s an increase of 23.9% from the year prior.
Hover over image to enlarge
For All U.S. Credit Unions
Source for all images unless otherwise noted:
Peer-to-Peer Analytics by Callahan & Associates
Despite a 1.9% annual decline, cash and cash equivalents remained the second-largest portion of the overall investment portfolio, representing 23.8% of total balances at the end of 2014.
Lower cash balances and higher-yielding asset purchases resulted in a rise in credit unions investment yield over the past year. This reached 1.24% as of December 2014, up 10 basis points from 2013.
| LENDING | AUTO LENDING | MORTGAGE LENDING |
| CREDIT CARDS | SHARES | INVESTMENTS |
| MEMBER RELATIONSHIPS | EARNINGS | RISK-BASED CAPITAL |
MEMBER RELATIONSHIPS
Members conducted more business, more often.
Thanks to accelerating loan growth and improving share growth, the average member relationship increased 3.7% over the past year to $16,753 as of December 2014.
Average loan balance per member, excluding member business loans, increased 6.8% and reached $6,706 at year-end. Lending activity contributed the most to overall relationship growth during this period, but higher penetration rates for share draft accounts as well as autos, credit cards, and mortgages all indicate members have strengthened their relationships with credit unions this year.
For All U.S. Credit Unions
Source: Callahan & Associates’ Peer-to-Peer Analytics
A Year One Century In The Making
Read the Industry Perfomance overview article by Jay Johnson, executive vice president at Callahan & Associates.
| LENDING | AUTO LENDING | MORTGAGE LENDING |
| CREDIT CARDS | SHARES | INVESTMENTS |
| MEMBER RELATIONSHIPS | EARNINGS | RISK-BASED CAPITAL |
Hover over image to enlarge
For All U.S. Credit Unions
Source for all images unless otherwise noted:
Peer-to-Peer Analytics by Callahan & Associates
EARNINGS
Back-to-basics proved fruitful.
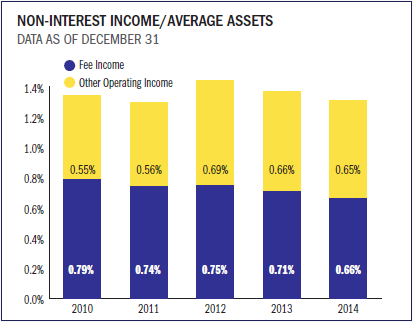
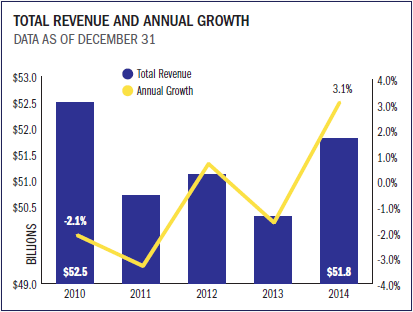
Underpinned by growth in loan and investment income, total income increased 3.1% annually to top $51 billion in 2014. Total interest income increased 4.5% annually, which helped offset a 0.2% decline in total non-interest income.
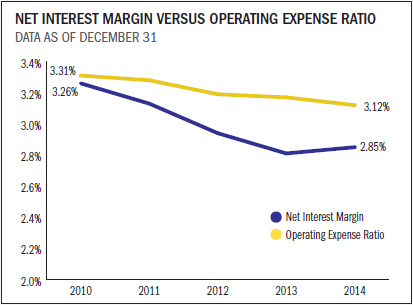
Loan interest income reached $33.0 billion in 2014; that’s an annual increase of 4.4%. As a result, the net interest margin expanded for the fourth consecutive quarter this time by four basis points.
Investment income climbed to $4.5 billion for the year at an annual growth rate of 5.4%. Meanwhile, total non-interest income fell 0.2% compared to the year prior, with other operating income’s gain of 3.6% unable to replace a 3.7% loss in fee income.
Fee income as a percentage of average assets declined five basis points annually; other operating income dropped one basis point. The decline in the latter is likely the result of changing mortgage conditions. Credit unions sold $31.5 billion in first mortgages to the secondary market in 2014; that’s a decrease of 43.0% from one year ago.
Despite environmental changes and regulatory hurdles, credit unions have skillfully managed their expenses. The industry’s operating expense ratio dropped five basis points to 3.12%. For 2014, the industry’s total return on assets was 0.80%, two basis points above 2013 levels.
-0.2%
Non-Interest Income Growth
4.5%
Interest Income Growth
3.1%
Growth In Total Revenue
| LENDING | AUTO LENDING | MORTGAGE LENDING |
| CREDIT CARDS | SHARES | INVESTMENTS |
| MEMBER RELATIONSHIPS | EARNINGS | RISK-BASED CAPITAL |
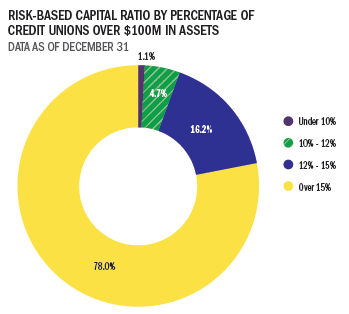
Hover over image to enlarge
For All U.S. Credit Unions
Source for all images unless otherwise noted:
Peer-to-Peer Analytics by Callahan & Associates