The S&P 500 and the Dow Jones Industrial Average were up 28.9% and 22.3%, respectively over the course of the year. By those measures, 2019 was the best year in the markets since 2013. This was supported by lower interest rates in the second half of 2019.Despite uncertainties surrounding global trade and recession fears, consumers searched for higher returns. As such, financial institutions felt the pressure to retain higher rates to attract consumer deposits.
Additionally, general uncertainty regarding the interest rate environment made it difficult for institutions to accurately price deposit and loan products. Many institutions locked in longer-term deposits last year at relatively high rates on the assumptionthat rates would continue to rise. This is reflected in year-end income statements, where cost of funds is up at a faster rate than revenue.
Key Points
- Total revenue at U.S. credit unions surpassed $82.6 billion in 2019, a calendar year record. Total revenue at credit unions nationwide increased 11.1% year-over-year.
- ROA across the industry increased 1 basis point annually to 0.93%.
- Interest income grew 13.3% year-over-year to $62.0 billion. Income from loans, up 12.4% annually to $53.5 billion, comprised 86.3% of total interest income. Income from investments, up 19.9% to $8.5 billion, accountedfor the remaining 13.7%.
- Interest expenses rose 38.3% annually to $13.6 billion. In absolute dollars, this lagged interest income gains and caused the net interest margin to increase 3 basis points annually to 3.16% as of Dec. 31, 2019.
- The industry’s average net worth ratio was 11.4% in the fourth quarter. More than 98.5% of credit unions reported a well-capitalized net worth ratio of 7% or higher at year-end.
TOTAL REVENUE AND ANNUAL GROWTH
FOR U.S. CREDIT UNIONS | DATA AS OF 12.31.19
Callahan & Associates | CreditUnions.com

Interest income increased 13.3% year-over-year and made up 75.0% of total revenue in 2019.
NET INTEREST MARGIN VS. OPEX
FOR U.S. CREDIT UNIONS | DATA AS OF 12.31.19
Callahan & Associates | CreditUnions.com

The net interest margin fell to 3.16% from 3.19% at the end of the third quarter, ending a streak of 16 consecutive quarterly increases.
RETURN ON ASSETS
FOR U.S. CREDIT UNIONS | DATA AS OF 12.31.19
Callahan & Associates | CreditUnions.com
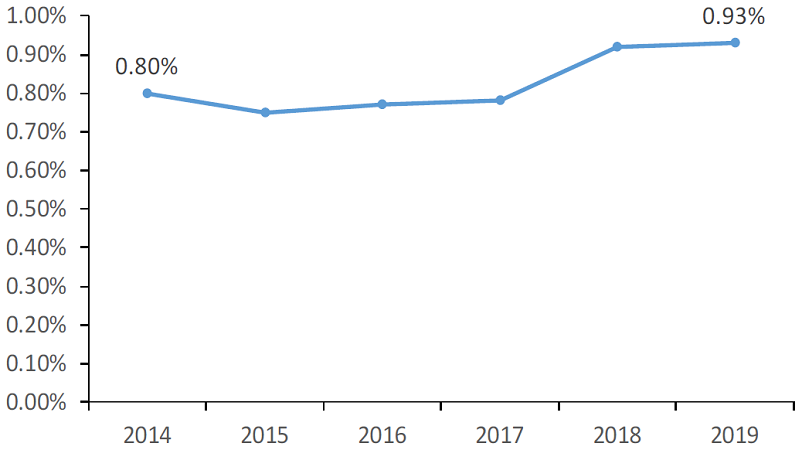
ROA began to plateau 2019 but remains strong at 0.93%.
The Bottom Line
The Federal Reserve hiked interest rates four times in 2018, and loan yields and annualized net income increased accordingly. Growth then began to slow following the mid-year 2019 rate cuts. Still, net income finished the year up 8.4% annually to $14.3billion.
This article appeared originally in Credit Union Strategy & Performance.