Callahan & Associates hosted its quarterly Trendwatch webinar on Thursday, providing an overview of the industry’s performance trends over the past three months, highlighted credit union success stories, and identifying areas of opportunity.
Here are three takeaways from this must-watch event.
No. 1: Share Growth Picked Up
Credit unions posted strong growth on both the deposit and lending sides of the balance sheet 5.9% and 8.0%, respectively. Annual deposit growth accelerated 31 basis points year-over-year. Deposits as of March 31, 2019, totaled nearly $1.3 trillion. This is a $72.3 billion annual increase from the $1.2 trillion recorded in the first quarter of 2018. Deposits grew $55.2 million quarter-over-quarter, the largest first quarter change on record.
Share certificates made up more than half 55.1% of the total year-over-year change in shares. Certificate balances grew 18.2% from the first quarter of 2018 to $257.4 billion, more than double the 6.6% rate credit unions reported one year ago.
TOTAL SHARE BALANCES AND ANNUAL GROWTH
FOR U.S. CREDIT UNIONS | DATA AS OF 03.31.19
Callahan & Associates | CreditUnions.com
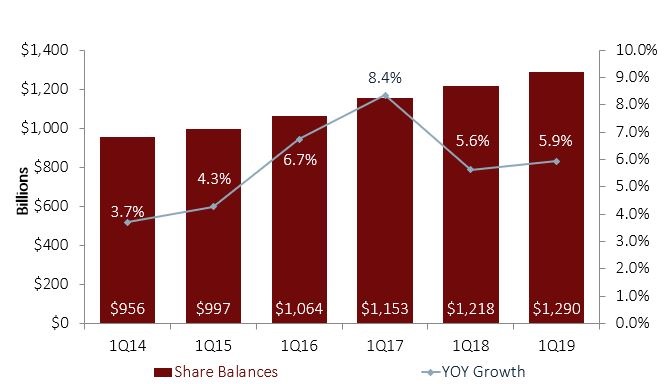
Share growth for the industry accelerates as credit unions compete for deposits in a highly competitive market.
How Do You Compare?
Go beyond the national averages and dive deeper into individual credit unions, peer groups, state, and more using Peer-to-Peer. Let us walk you through your numbers with a custom performance scorecard.
No. 2: Delinquency Was The Lowest Since 2006
Despite strong lending activity, total delinquency at U.S. credit unions has improved. It fell 7 basis points year-over-year to 0.59%, the lowest level in more than 10 years. In the first quarter of 2019, delinquency broadly improved across most product categories. The net charge-off ratio improved as well, dropping 3 basis points from 0.60% in the first quarter of 2018 to 0.57% in the first quarter of 2019.
Credit unions reported the lowest delinquency of any loan type in first mortgages. At 0.40%, that’s an improvement of 3 basis points year-over-year. Credit card delinquency rose 2 basis points year-over-year to 1.26% as of March 31.
NET CHARGE-OFF RATIO & DELINQUENCY RATIO
FOR U.S. CREDIT UNIONS | DATA AS OF 03.31.19
Callahan & Associates | CreditUnions.com
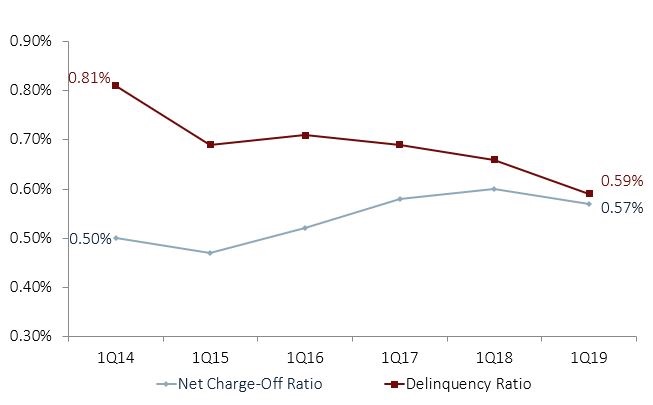
Asset quality improves as delinquency falls 7 basis points and net charge-offs fall 3 basis points, year-over-year.
No. 3: Yields Increased Across Major Measures
Credit unions continued to see the results of the four interest rate hikes in 2018, with 11.0% year-over-year revenue growth. Interest income grew 15.0% year-over-year, accounting for 75.0% of growth in revenue. Interest income from investments increased 24.2% year-over-year, driving yield on investments 55 basis points higher to 2.34%.
The 13.0% increase in loan income pushed loan yields 17 basis points higher to 4.76% in the first quarter of 2019. Although loan yields continued to creep higher, the average cost of funds increased at a faster rate. That was up 15 basis points to 0.93% due to sustained liquidity pressures, rising rates, and market competition.
YIELD ANALYSIS (ANNUAL)
FOR U.S. CREDIT UNIONS | DATA AS OF 03.31.19
Callahan & Associates | CreditUnions.com

Yields continue to increase across major measures as a result of 2018 rate hikes, with yield on investments and yield on loans up 55 and 17 basis points, respectively.