Credit unions that participate in CUSOs are growing in numbers and perform better in many metrics than those that don’t.
The numbers don’t lie, but this is still a chicken-or-the-egg scenario. Does CUSO participation drive better performance, or do credit unions that do business in demonstrably superior ways participate in CUSOs?
The answer is likely some of both; however, there are insights to be gleaned from looking at how investment and participation in CUSOs has increased in recent years a movement within a movement.
ContentMiddleAd
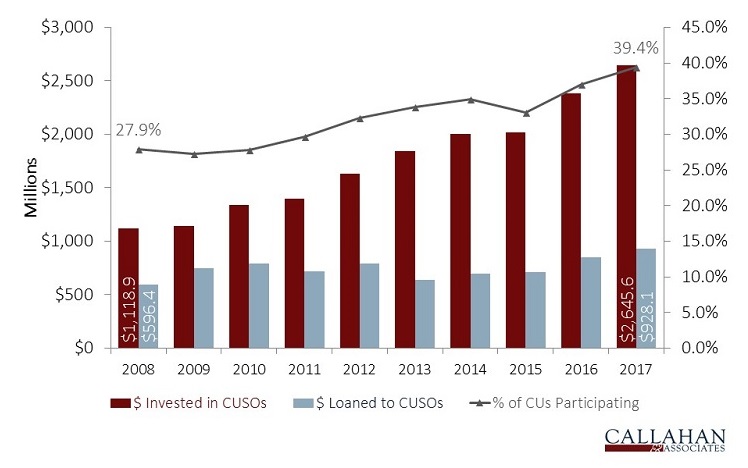
Nearly 40% of the nation’s 5,689 credit unions have an investment or loan or both in a CUSO. There are approximately 1,100 CUSOs, with about 380 multi-owned and more than 700 wholly owned.
The latter are typically outsourced service offerings, whereas the former tend to be more wide-ranging collaborations that leverage cooperative processes and economies of scale as credit unions take on the challenges and opportunities of changing technology and growing competition.
CREDIT UNION CUSO PARTICIPATION
FOR U.S. CREDIT UNIONS | DATA AS OF 12.31.17
Source: Callahan & Associates.
As the bar chart above shows, investment in CUSOs has more than doubled in the past decade. Loans to CUSOs nearly did, and overall participation increased 11.5 percentage points.
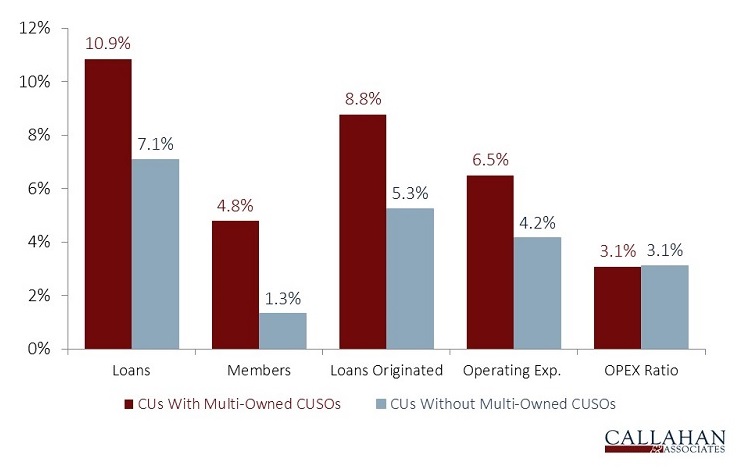
Regarding multi-owned CUSOs, the chart below shows performance is most markedly different in the areas of loan and member growth, two undoubtedly crucial and interrelated metrics.
5-YEAR GROWTH RATES
FOR U.S. CREDIT UNIONS | DATA AS OF 12.31.17
Source: Callahan & Associates.
Sure, operating expenses on average have grown faster at multi-owned CUSO credit unions than at their counterparts; however, that growth is likely a result of escalating operating costs required to keep pace with their own growth. It takes more staff, marketing, and technology investment to increase loan balances, deposit balances, and membership rolls. It also takes more to care for these accounts. More eggs. More chickens.
MULTI-OWNED CUSOS BY SERVICE TYPE
FOR U.S. CREDIT UNIONS | DATA AS OF 12.31.17
Source: Callahan & Associates.
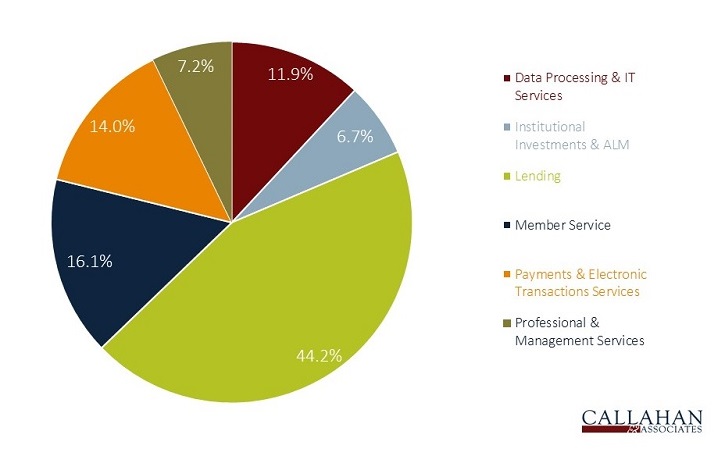
Lending-focused organizations comprise nearly 45% of all CUSOs. That’s a big pool that includes everything from mortgage originations to collections. Member service, which includes shared branching, is at No. 2. And at No. 3 are payment CUSOs, which represent ownership in the PSCUs and CO-OPs of the world.
PARTICIPATION IN CUSOS AND 5-YEAR ANNUAL ASSET GROWTH BY PEER GROUP
FOR U.S. CREDIT UNIONS | DATA AS OF 12.31.17
Source: Callahan & Associates.
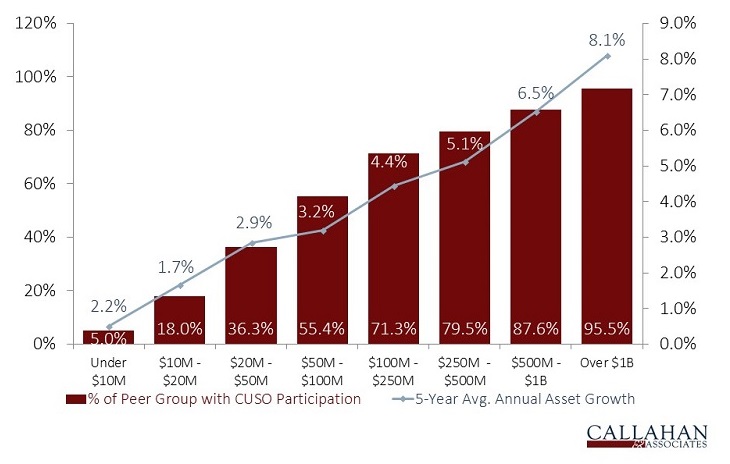
The bar and line graph sheds light on the fact that larger credit unions are more likely to participate in CUSOs. It’s a stairstep relationship, although the steps are of different sizes and range from 5.0% participation for the smallest credit unions to 95.5% engagement in the billion-dollar-plus club.
Asset growth over the past 10 years shows much the same and again demonstrates that CUSO participation is as much a characterization as tactic in this kind of discussion. The larger the credit union, the more it can do, and the larger it becomes.
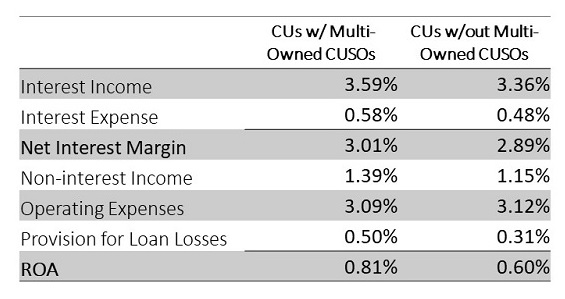
CREDIT UNION EARNINGS MODEL
FOR U.S. CREDIT UNIONS | DATA AS OF 12.31.17
Source: Callahan & Associates.
As the Credit Union Earnings Model table shows, there are notable differences in performance between non-CUSO owners and CUSO owners regardless of size. Of note is the relatively higher interest income from both lending and investments reported by credit unions that use CUSOs, translating into higher net interest margins.
Another big differentiator is non-interest income; dividends and operating income from CUSO investments are recorded as NII. That contributes to a 21-basis point difference in ROA between non-CUSO credit unions and their counterparts that do participate. That’s a significant difference, especially considering this is in the aggregate. It’s all credit unions of all sizes in each of these pools, not necessarily skewed by asset size.
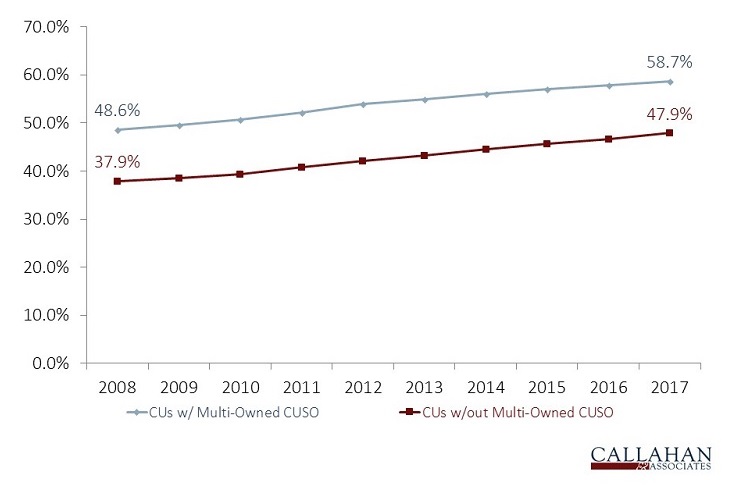
SHARE DRAFT PENETRATION
FOR U.S. CREDIT UNIONS | DATA AS OF 12.31.17
Source: Callahan & Associates.
Share draft penetration is a cornerstone indication of primary financial institution status. There was a 10.8 percentage point gap between multi-owned CUSO credit unions and their counterparts at year-end 2017. That gap is nearly identical to 10 years earlier and has stayed the same as penetration for both groups rose.
Are members choosing a credit union as their PFI because it is large and has more services, or are credit unions growing and offering more services because the number of people choosing credit unions as their PFI is growing? And does investing and engaging with CUSOs drive that growth?
This analysis can’t provide a definitive answer; however, it does clearly show CUSO involvement is a common characteristic among successful credit unions. The diversified revenue stream, efficiency increases, and economies of scale combined with the collaborative nature of CUSOs make it easier for credit unions to take all their eggs out of one basket and hatch a recipe for success.
This article appeared originally in the Credit Union Times April 2018.

