Auto lending soared in the first quarter of 2015. Thanks to a healthy auto market and rising members’ demand for cars, auto lending now makes up over 32% of credit union’s loan portfolios. The number of indirect, new, and used auto loans reached 25.3 million as of March 2015. That’s a 2.6 million increase year-over-year.
FIRST QUARTER AUTO MARKET SHARE
For all U.S. credit unions | Data as of 03.31.15
Callahan & Associates | www.creditunions.com
Source: Auto Count
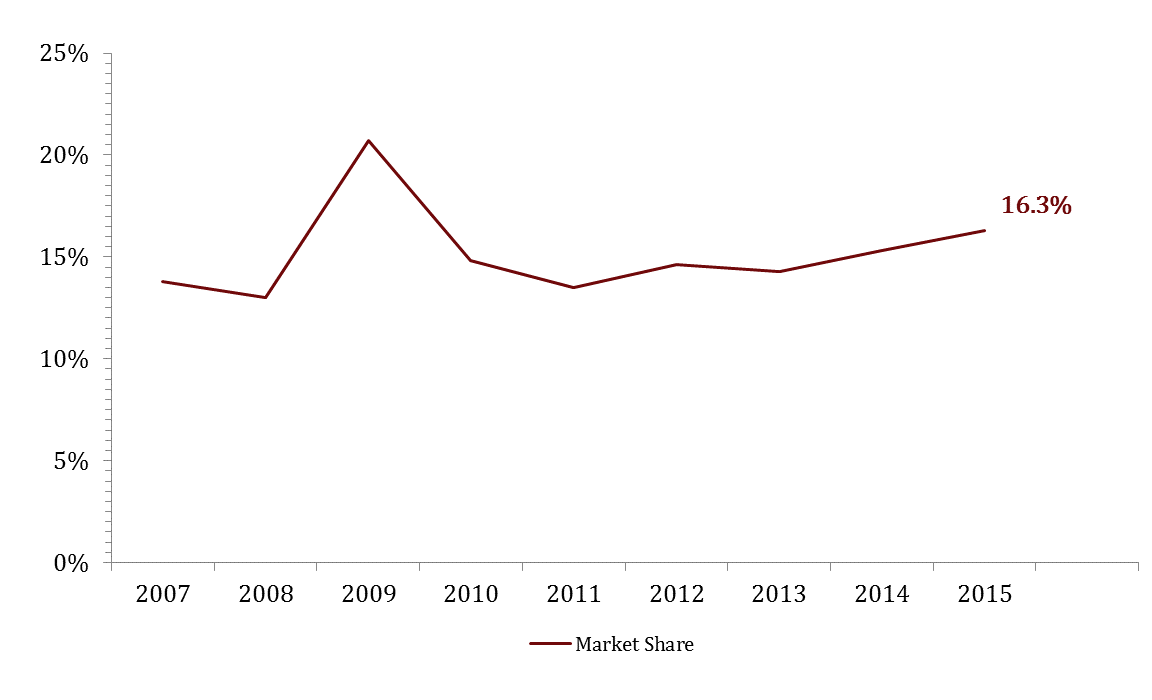
First quarter market share increased 1 percentage point year-over-year, reaching 16.3% in March 2015. This is the credit unions highest point since 2009, where they experienced an auto market share of 20.7%.
NEW AND USED AUTO
For all U.S. credit unions | Data as of 03.31.15
Callahan & Associates | www.creditunions.com
 Source: Peer-to-Peer Analytics by Callahan & Associates
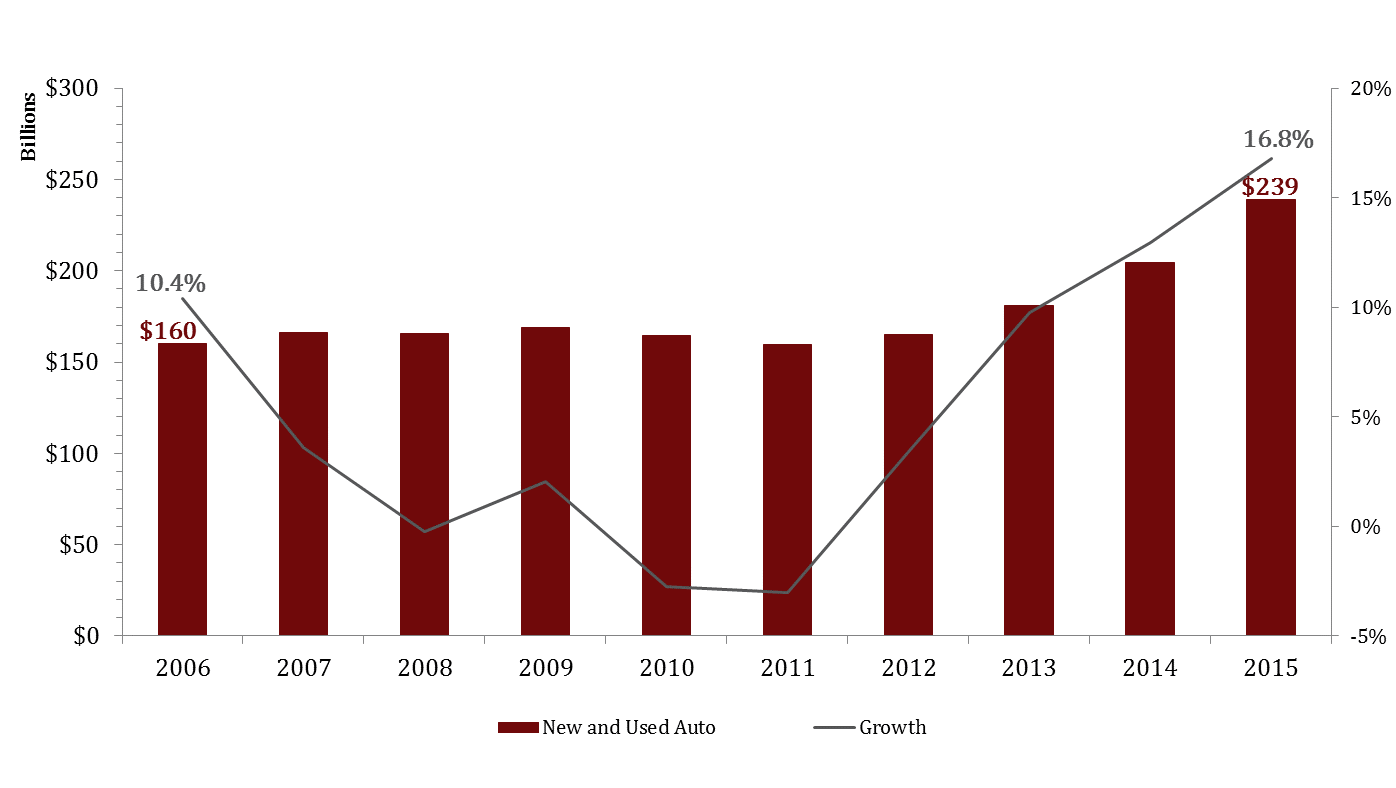
New and used auto balances grew 16.8% in 2015, reaching $239 billion. Credit unions added over 1.5 million auto loans to their portfolio year-over-year, growing the number of outstanding loans to 18.0 million as of March 2015. The average loan balance as of March 2015 was $13,292, up from $12,547 in March 2014.
DIRECT VS. INDIRECT AUTO LENDING
For all U.S. credit unions | Data as of 03.31.15
Callahan & Associates | www.creditunions.com
 Source: Peer-to-Peer Analytics by Callahan & Associates
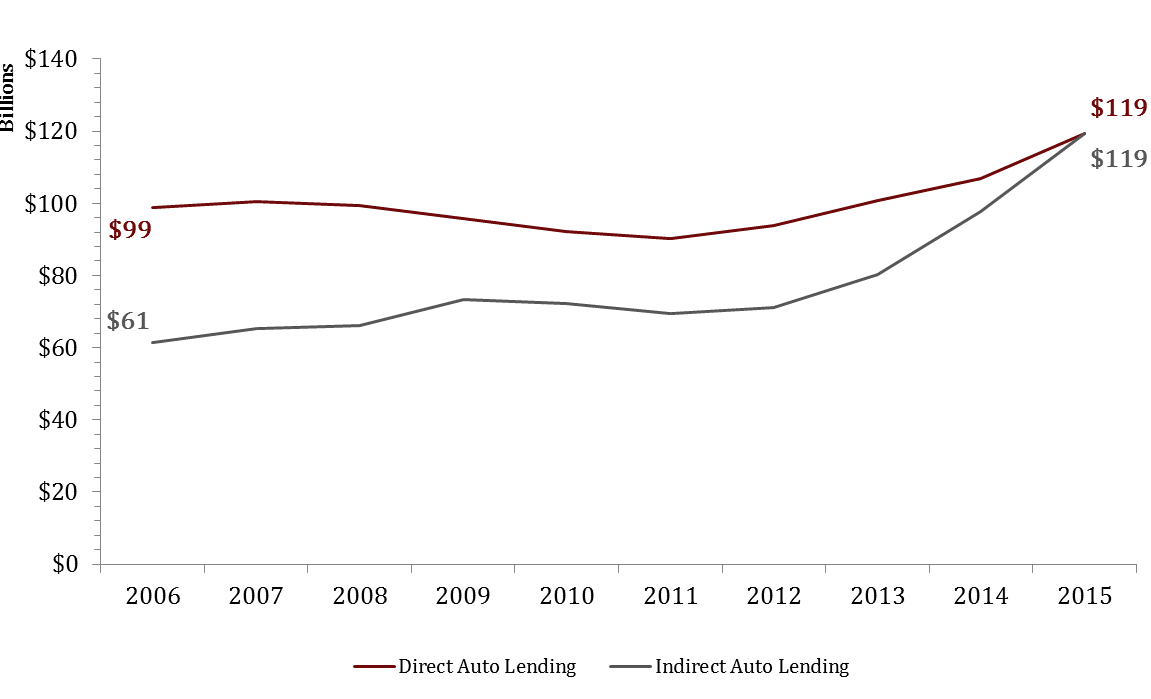
Direct and indirect auto lending grew year-over-year reaching a total balance of $238 billion. Indirect lending has become more popular among credit unions in recent years, now on par with direct auto lending.
INDIRECT LENDING
For all U.S. credit unions | Data as of 03.31.15
Callahan & Associates | www.creditunions.com
 Source: Peer-to-Peer Analytics by Callahan & Associates
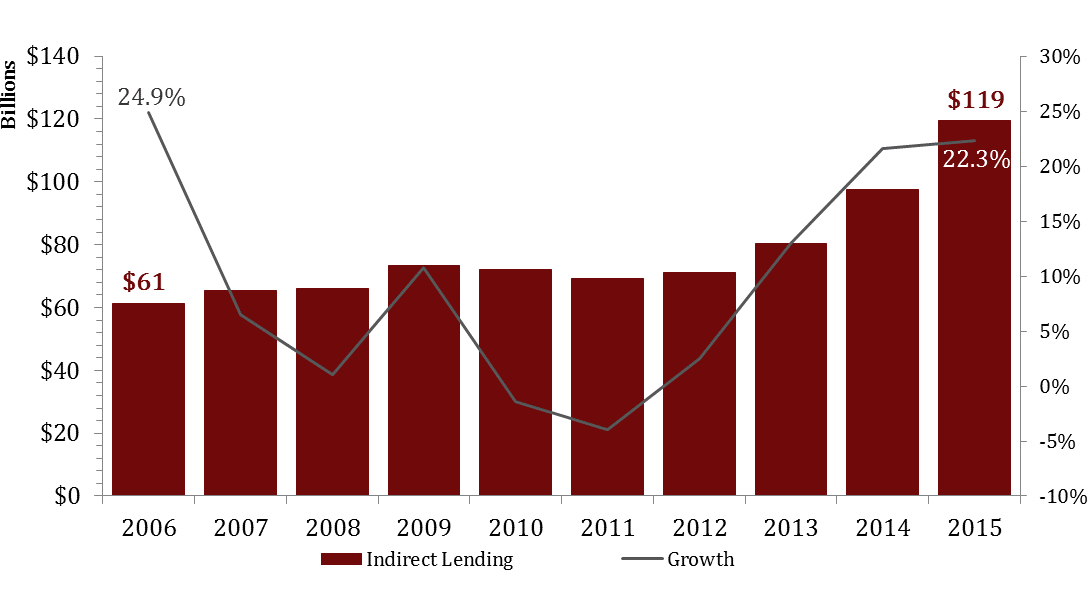
Indirect landing grew at a rate of 22.3% between March 2014 and March 2015, its highest growth rate since March 2006. Indirect lending balances have hit an all-time high of $119 billion, with an average loan balance of $16,247.
| Rank | State | Credit Union | Growth | Assets |
|---|---|---|---|---|
| 1 | CA | San Diego County | 128.74% | $6,905,956,228 |
| 2 | MI | Dow Chemical Employees | 97.14% | $1,501,213,241 |
| 3 | PA | TruMark Financial | 86.45% | $1,632,296,037 |
| 4 | VA | Northwest | 85.63% | $2,834,472,116 |
| 5 | IL | Alliant | 83.78% | $8,320,374,695 |
| 6 | TX | American Airlines | 82.94% | $5,707,160,404 |
| 7 | WI | Connexus | 81.06% | $1,081,805,707 |
| 8 | CA | Ventura County | 80.47% | $725,499,888 |
| 9 | MI | Team One | 78.21% | $430,502,376 |
| 10 | CA | Premier America | 66.28% | $1,770,793,553 |
*Credit unions included in the leader table had a minimum of $50 million in auto loans as of March 2014 and if they had merged in the last year had a merger rate of less than 10%.
Credit unions are experiencing record breaking growth rates in their new and used auto portfolios. This is a result of a strengthening economy and favorable rates for credit union members.
