Top-Level Takeaways
-
Starting with a 2014 core conversion, St. Mary’s Bank has taken a four-year journey deeper into business intelligence and analytics.
-
Before it could leverage the full power of analytics, the nation’s oldest credit union first needed employee buy-in to try a new reporting technology and automate hundreds of manual reports.
Melissa Pomeroy was working as an IT consultant in Washington, DC, in 2014 when she got an offer from St. Mary’s Bank ($1.0B, Manchester, NH) to lead the nation’s oldest credit union through a core conversion.
“It was a massive effort”, the now-director of business analytics and project management says.
That’s because it was more than just a core conversion. The credit union, in fact, upgraded 67 different databases, data feeds, and systems.
“At the start of its conversion, St. Mary’s Bank hired a consulting firm to help the cooperative clean up its data, which, for decades, had no quality control or cleanup efforts and minimal purging” Pomeroy says. Her team identified tens of thousands of data elements the credit union needed to address before its conversion.
“We wanted to go into our new core system with clean data” she says.
To track the credit union’s data-cleaning efforts, the consulting firm developed data quality dashboards through the Tableau visualization platform. This was St. Mary’s Bank’s introduction to Tableau and its first steps in its subsequent analytics journey.
Easing Into Analytics
To best use the visualization software for data cleanup, St. Mary’s Bank created a data warehouse to house source data from disparate providers, including FICS, Mortgagebot, MeridianLink, Episys, and others.
Building a data warehouse from scratch allowed Pomeroy to set and maintain a consistent standard for data quality at the point of entry rather than retroactively cleaning a legacy warehouse. For her and others in the credit union to feel good about the data, it had to be accurate, well-organized, and originate from a trusted source.
“We had to make sure we were sourcing and organizing data consistently across all our business areas” Pomeroy says. “We had to make sure our single source of truth was universally accepted.”
But although the data going in was vetted, business unit employees had a harder time building reports from it. According to Pomeroy, employees could not simply query the core production like they had before. Additionally, the reports they were pulling looked different.
“Users were frustrated, struggling, and angry” she says. “We had to help them.”
To meet that immediate need, Pomeroy leveraged Tableau as a mechanism for users to filter and export data to create reports. Called “workbenches” the credit union has created four high-level dashboards in the past three years, the final two in 2018, aligned around debit and credit card, loan, member, and transaction data sets.
“If you want to know how many charged-off loans we have on the books, how many charged-off car loans come from a specific dealer, how many charged-off credit cards, how many loans we originated in the past quarter, you enter your search dimensions and filters and get that information” Pomeroy says. We tried to give our business units the ability to get the data they need. We didn’t just jump into analytics.
In addition to providing quick access to data, St. Mary’s Bank’s workbenches also serve to familiarize employees with Tableau, which made the next step in the credit union’s analytical journey easier.
Bottoms Up
Next, Pomeroy alleviated the institution’s reliance on time-intensive, imperfect, manual reporting, starting with the credit union’s business units. She met with managers from the departments that most used the Tableau workbenches consumer lending, deposit operations, loan servicing, collections, and others to learn how these teams were using the data and what manual reports they were creating.
“We asked what reports they needed to deliver most often” she says. “We told them, Why don’t we just do this for you?”
Rather than Pomeroy unilaterally building dozens and dozens of reports, this bottom-up approach allowed her to understand departmental need while at the same time garnering buy-in from users.
“We started bottom-up to gain credibility by helping people with what they needed” she says. “They appreciated it because they saw how we could eliminate some difficult, tedious, manual work.”
This knowledge in tow, Pomeroy with the help of the data consulting firm used during the core conversion created a prioritized list of reports to deliver to the business units. Those built, Pomeroy then asked department managers to validate her reports against what they had previously built manually to ensure nothing was lost in translation.
“Some people said it won’t be right, or they had to do it manually” Pomeroy says. “It took convincing to show them they didn’t have to build reports manually anymore.”
An example of one of these reports is the dealer report card for the consumer lending department. St. Mary’s Bank carries a higher percentage of indirect loans than state, peer, and national averages and works with a wide swath of car dealerships. This report shows how many loans the credit union sourced from a given dealer, the credit scores of borrowers who come from a given dealer, how those loans perform over time, and more.
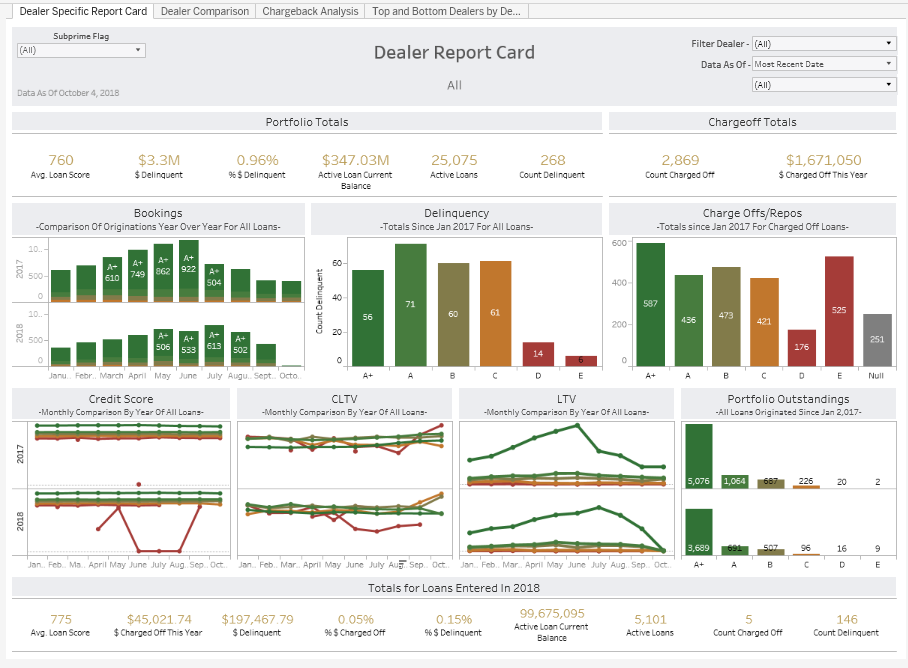
St. Mary’s dealer report card details many aspects of the credit union-dealer relationship. Click to enlarge.
For the vast reporting needs of the collections department, Pomeroy and her team built a series of automated reports to expedite the reporting process: a delinquency report, a consumer loan loss report, and both a year-to-date and month-to-date charge-off report.
“Now, the collections department opens the report in the morning and all they need is right there” Pomeroy says.
Ideally, your data analytics programs help develop a fully data-driven organization where every decision leadership makes is based on the information presented to them. That’s utopia.
Top-Down
Departments were saving time and making fewer mistakes by eliminating manual reporting from their jobs, but the reporting itself was still the same. There was little that was strategic about it, Pomeroy says. And building automated reports to meet departmental need was not analytical.
“Ideally, your data analytics programs help develop a fully data-driven organization where every decision leadership makes is based on the information presented to them” she says. “That’s utopia.”
So, St. Mary’s Bank shifted from bottom-up to top-down.
“We want to provide information that can help managers and our executive team make decisions” Pomeroy says.
To date, the biggest top-down win has come from the credit union’s retail area.
St. Mary’s Bank has nine branches, all of which have location-specific deposit and loan goals; branch staff, too, have individual deposit and loan goals that support the credit union’s larger organizational goals. All this information lived on a multi-page spreadsheet that one employee manually created at the end of each month. To input employee, branch, and credit union performance and calculate progression toward monthly, quarterly, and yearly goals required days of work. For the SVP of retail and branch managers, this was an invaluable document.
Pomeroy and her team analyzed the report process and spent weeks testing and validating the data before deploying a branch status dashboard. The report shows the same month-, quarter-, and year-to-date performance and the given percent toward goal, but the performance is updated nightly. And, it’s automated.
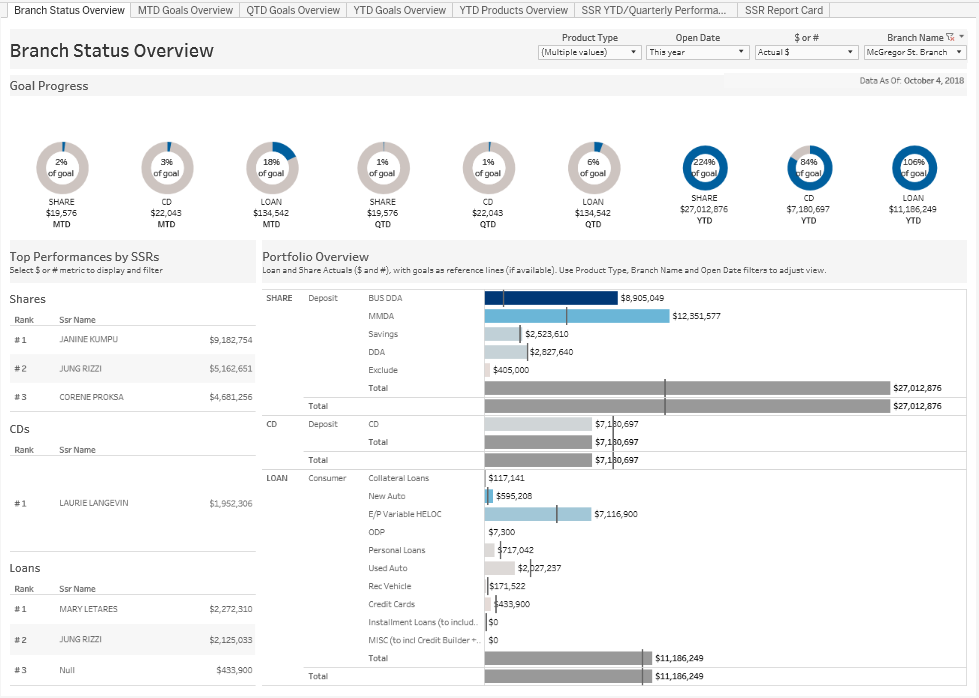
St. Mary’s branch status overview details top performances and provides nightly updates toward goals. Click to enlarge.
“An employee can see they’re already 100% of the way toward their quarter goal for share deposits” Pomeroy says. “They might need to focus instead on loans or CDs.”
Looking forward, Pomeroy would like to see data-driven decision-making like this flow into the higher levels of the credit union. One part of that requires continued education on the capabilities of business intelligence and analytics and Tableau’s place in it. To date, St. Mary’s Bank has held six sessions of what it calls Tableau Office Hours. In these sessions, the 60 credit union employees with a Tableau license learn more about the software, ask questions, and work out use cases in real time. Past sessions have included refreshers on the credit union’s data quality program and workbenches, as well as more granular sessions explaining how to filter data in different dashboards.
Another part requires providing the executive team the reports they need to make decisions. Currently, Pomeroy has built a dashboard that shows the credit union’s performance on several KPI metrics, including efficiency ratio and return on assets, but there’s more she wants to build. Near the top of that list is an analytical model that can predict, based on various factors, when a member might be gearing up to terminate his or her membership.
“We want to be more predictive” Pomeroy says. “I’d love to make the attainment of our goals as data-driven as possible.”