Read the full analysis or skip to the section you want to read by clicking on the links below.
LENDING AUTO LENDING MORTGAGE LENDING CREDIT CARDS MEMBER BUSINESS LENDING SHARES INVESTMENTS MEMBER RELATIONSHIPS EARNINGS SPECIAL SECTION: EMPLOYEE ENGAGEMENT
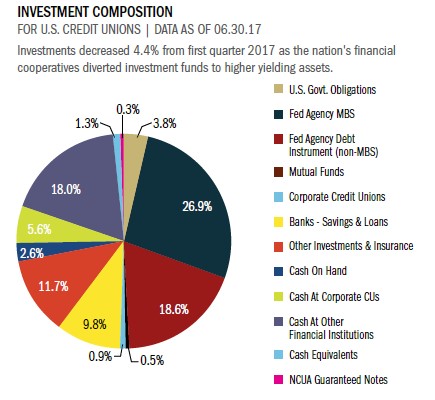
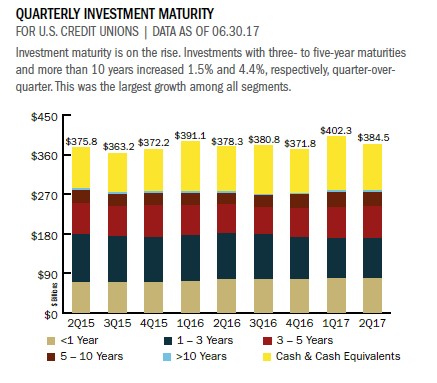
The credit union industry’s investment portfolio increased 1.6% year-over-year, with investments totaling nearly $384.5 billion at the end of second quarter 2017.
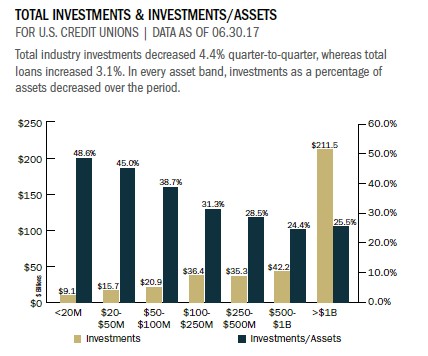
Investment growth at credit unions has been positive for four out of the past six quarters; however, the tepid growth in the second quarter of this year is indicative of credit unions continued focus on their lending operations. At times, the nation’s financial cooperatives have diverted assets from the investment portfolio to fuel higher-yielding loan growth.
As interest rates have gradually moved upward, investment yields likewise have posted steady gains. As of June 30, 2017, the yield on average investments was 1.54%. That’s an improvement of 10 basis points over first quarter’s 1.44% and an improvement of 20 basis points above June 30, 2016. This quarter’s yield was the highest since Dec. 31, 2011.
Although investments posted year-over-year positive growth, they declined 4.4% quarter-over-quarter. This downswing is typical of past second quarters. The quarterly change brought with it an adjustment in maturities as well, with notable decreases in holdings of cash and cash equivalents. The share of cash in the investment portfolio fell to 27.5%, down from 30.6% in the first quarter. Investments with maturities of three to five years increased during the second quarter, and, at $71.5 billion, now make up 18.6% of the investment portfolio.
Total industry investments in US Government Obligations increased from $10.3 billion to $14.4 billion year-over- year. That’s an upturn of 40.7%. Other notable annual increases in the investment portfolio include NCUA guaranteed notes, which notched up 12.6%, and cash at corporate credit unions, which rose 7.2%. Fed Agency MBS and debt instruments still accounted for the largest percentages of the investment portfolio at 26.9% and 18.6%, respectively.
Click the graphs below to enlarge and then continue reading to see how Purdue Federal Credit Union is using rate swaps and hedging to simultaneously damper interest rate risk and generate revenue.

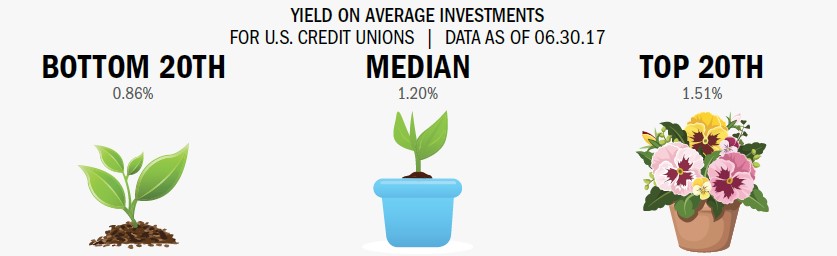
Yields on investments have gradually been increasing across the industry. The bottom 20th, median, and top 20th were all up 10, 9, and 8 basis points, respectively since first quarter 2017.
CASE STUDY
PURDUE FEDERAL CREDIT UNION
Purdue Federal Credit Union is using rate swaps and hedging to simultaneously dampen interest rate risk and generate revenue.
Purdue Federal began interest rate swaps shortly after the NCUA granted the credit union derivativetrading approval in December 2015. Since then, the strategy has generated approximately $1.5 million in extra interest income from the loans Purdue Federal has held rather than sold.
These swaps are basically agreements between the credit union and a trading partner to trade one stream of interest payments for another over a set period. Derivative contracts have allowed Purdue Federal to hold an additional $80 million in first mortgages in a real estate loan portfolio that grew 18.71% year-over-year to $628.42 million in the second quarter of this year.
Meanwhile, the credit union expects its mortgage pipeline hedging strategy to add 3 basis points a year to its ROA.
Purdue Federal works with an outside advisor to administer the program, which helps the credit union provide rate locks to members while mitigating risk from rising interest rates. The strategy involves evaluating new loans daily, lowering risk by taking daily losses and gains while committing the mortgages to future sales as much as 120 days out at a to-be-announced price.
Hedging helps dampen the market risk that occurred when Purdue Federal was selling loans to Fannie Mae with the typical 45-day delivery date. So do the four interest rate swap transactions the credit union currently has on its balance sheet.
Whereas these kinds of debt and trading instruments are considered quite liquid and fairly plain vanilla in trading circles, they’re not for amateurs.
I wouldn’t recommend going out and trying to do these yourselves, says Brian Musser, Purdue Federal’s CFO since 1991. The Indiana credit union depends on its outside advisor to manage the swaps and trades.
Read The Whole Story

Strategy & Performance 2Q 2017
Credit unions are indeed having an outstanding 2017 right on the heels of a very strong 2016 and 2015. Eliminating barriers and connecting with members distinguishes credit unions from other financial institutions and makes the movement stronger than it’s ever been. Learn what the industry’s most successful credit unions are doing in this issue of Strategy & Performance.
Read More
The data in this article was pulled using Callahan’s Peer-to-Peer software.Learn more about Peer-to-Peer.
RETURN TO INDUSTRY PERFORMANCE BY THE NUMBERS 2Q 2017