What Would A 10% Credit Card Rate Cap Mean For Credit Unions And Members?
A closer look at the trade-offs of mandated lower credit card rates reveals a delicate balance between portfolio health and member access.

Hands-on work with artificial intelligence tools is future-proofing staff members, giving them the confidence to adopt new technology and embrace efficiencies.
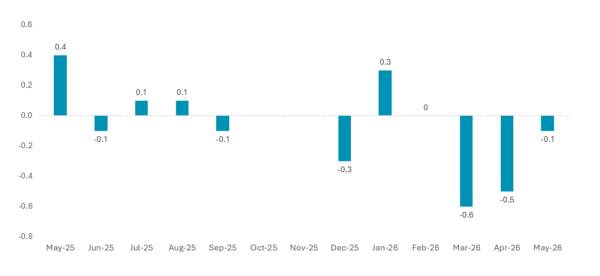
Wages briefly caught up with inflation, but rising costs have pushed them back into negative territory. Here’s what that shift means for member finances and credit union performance.

Suncoast Credit Union balances near-term needs with longer-term bets, applying discipline to timing, valuation, and fit to decide when to invest and when to walk away.

Looking for quarterly data coverage, expert analysis, lessons from leading credit unions, and more? Callahan has it covered. Comparing top-level performance and digging into the details has never been easier.

First quarter data shows how rising costs are pushing consumers toward flexibility and reshaping borrowing and saving habits.

A dedicated CUSO holding company allows WSECU to move beyond building and back fintech partners it helps shape and scale.

Advancial FCU links internal service standards, employee feedback, and peer recognition to create a more consistent experience for both staff and members.

MSUFCU takes a hands-on approach to fintech, piloting solutions through its in-house lab before scaling and backing them through a wholly owned CUSO.

Affinity Plus FCU has a clear member service mantra: digital for daily, human when it’s hard. Its CEO and CFO share what that looks like in practice.
The New Hampshire cooperative shares how its fintech arm, Service Ventures, evaluates investments, balances risk, and defines success.