Financial institutions — credit unions, in particular — operate at the crossroads between macroeconomics and everyday Americans. Applying economic context to financial performance can shed light on data and offer new perspectives.
Benchmarking against peers helps credit unions track their performance; however, credit unions do not operate in a vacuum. Even the most distinct, innovative institution is in many ways beholden to the environment in which it operates. That’s why Callahan & Associates has developed a dashboard in Peer Suite that allows users to evaluate credit union industry data using macroeconomic data.
The Federal Funds Rate And Loan And Investment Yield
FEDERAL FUNDS RATE AND YIELD
FOR U.S. CREDIT UNIONS | DATA AS OF 06.30.23
© Callahan & Associates | CreditUnions.com
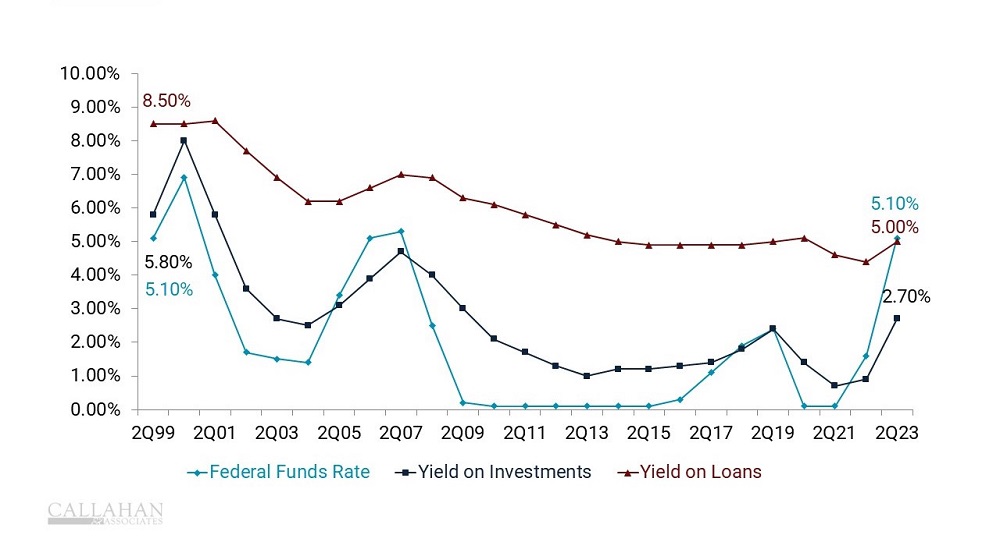
With the federal funds rate climbing, yields on credit union loans and investments have ticked up, albeit at differing paces. That’s not surprising for investment yields because an increase in the federal funds rate impacts Treasury rates and boosts yields. What is interesting in today’s environment is that the federal funds rate has nearly converged with yield on loans. Despite large upswings in the federal funds rate, credit unions have seen little of that trickle down to boost the yield they make on their loan portfolio.
The sizeable increase in the yield on investments combined with the slight increase in yield on loans has underpinned a recent surge in the net interest margin, which has now surpassed operating expenses. This bump means credit unions can keep the lights on with only interest income, which gives them flexibility when it comes to other types of income. For example, credit unions can lower fees and improve the member experience. However, if the Fed lowers rates in the coming year, the net interest margin could contract again, which would leave credit unions with less flexibility.
Unemployment And Delinquency
UNEMPLOYMENT RATE AND DELINQUENCY
FOR U.S. CREDIT UNIONS | DATA AS OF 06.30.23
© Callahan & Associates | CreditUnions.com

Historically, delinquency and unemployment have moved together in the United States. When there’s a gap in income, it’s more difficult for people to keep up with their bills. This relationship was starkly illustrated during the 2008 global financial crisis and unemployment reached levels not recorded since the Great Depression. In December of 2009, the unemployment rate reached 9.9%; delinquency ticked up to 1.43%.
During the early months of the COVID-19 pandemic, unemployment jumped as many Americans suffered layoffs or furloughs. However, relief funds provided by the federal government helped many people keep up with loan payments. Some states also offered aid of their own, and expanded unemployment benefits were available to many. Consequently, delinquencies remained low during this period and the economy rebounded quickly.
Today, unemployment remains at near-historic lows, yet the delinquency rate has ticked higher in recent quarters. Economic theory states low unemployment pushes businesses to raise wages to remain competitive employers; consequently, inflation increases. Stretched budgets make it harder for borrowers to pay back loans, which has driven this recent uptick in delinquency.
Personal Savings And Share Balances
PERSONAL SAVINGS RATE AND ANNUAL SHARE GROWTH
FOR U.S. CREDIT UNIONS | DATA AS OF 06.30.23
© Callahan & Associates | CreditUnions.com

The personal savings rate — the portion of income Americans save — has remained relatively consistent during the past 15 years. But the pandemic altered consumers’ relationship with savings. Government-sponsored economic relief combined with fewer experiences on which to spend money helped people increase their personal savings rate and credit union members deposit more shares.
Unfortunately, when consumers save too much, businesses sag under lack of spending. But, when consumers save too little, financial institutions lose the liquidity necessary to make loans. This is what the economist John Maynard Keynes referred to as “the paradox of thrift.”
The U.S. personal savings rate has traditionally lagged other developed economies. For example, at midyear 2023, it was 4.6% versus 6.9% for the Eurozone. In 2021, the Swiss personal savings rate was a whopping 21.9%. Despite several theories, economists are not quite in agreement on why the U.S. savings rate is so low. Indisputable is the fact that softer savings means credit unions have less liquidity to lend.
As illustrated here, credit union performance data combined with macroeconomic data helps paint a more detailed picture of what is happening within the credit union industry. Credit unions as well as their members exist in a world of unemployment, fluctuating savings, moving interest rates, and more. Including macroeconomic data in performance analysis helps credit union leaders more accurately strategize and better prepare for what the future might hold.
Do You Consider Macroeconomics In Your KPIs?
Request Your Scorecard Today