Many of the year’s trends continued into the final quarter of 2022. High inflation and increased interest rates strained members’ wallets. According to the U.S. Bureau of Economic Analysis, the personal savings rate was 3.4% in December, down from a record high of 33.8% in April 2020.
At credit unions, surging loan growth and slowing share growth has put pressure on liquidity. The industry has leaned into loan demand, and the net interest margin exceeded the operating expense ratio for the first time since 2019. But despite healthy lending, earnings, and capitalization, asset quality is beginning to decline on the heels of historically low delinquency during the pandemic.
Indirect lending, specifically, has surged at credit unions. This is an effective way to add members — the industry added more members than ever in a single year — and presents the opportunity to serve potential members looking for a relationship deeper than money changing hands. Credit unions are stewards of financial wellbeing, and they must implement ways to build strong financial relationships with indirect members dissatisfied with their financial situation.
During its quarterly Trendwatch webinar, Callahan & Associates reported on key trends in the credit union industry and economy. Read on for five takeaways from fourth quarter performance data.
No. 1: Annual Share Growth Was The Lowest Since 2014
12-MONTH SHARE GROWTH BY SEGMENT
FOR U.S. CREDIT UNIONS | DATA AS OF 12.31.22
© CALLAHAN & ASSOCIATES | CREDITUNIONS.COM
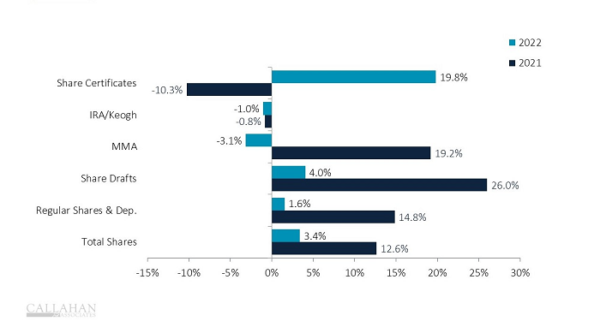
- Deposits grew 3.4% year-over-year. Money market accounts, one of the fastest-growing share types during the pandemic, contracted annually. Share drafts and regular shares increased at sub-5.0% rates. Of note, growth is slower, but dollar balances remain at record levels.
- Share certificates were up 19.8% year-over-year. This is the highest YOY growth since the start of the pandemic, when share certificates contracted in most quarters. This growth is part of an effort to attract deposits to fund loan demand.
No. 2: Origination Balances Declined
YTD LOAN ORIGINATIONS
FOR U.S. CREDIT UNIONS | DATA AS OF 12.31.22
© CALLAHAN & ASSOCIATES | CREDITUNIONS.COM
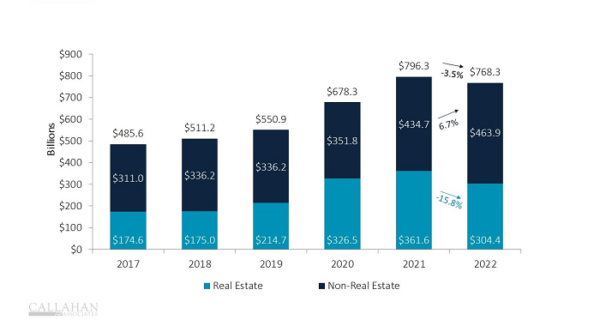
- The dollar value of loans granted declined 3.5% annually thanks to a 15.8% decline in real estate originations. Although credit unions continued to lend in smaller, consumer loan products such as auto and credit cards, the overall number of originations declined 10.3%. The number of loans granted declined year-over-year throughout 2022.
- Younger members are struggling to enter the real estate arena. According to the National Association of Realtors, the average age of a first-time homebuyer has risen to 36, and those borrowers account for just 26% of homebuyers, down from 34% last year. The median homebuyer age — first time or not — reached 53, the oldest ever recorded.
No. 3: Credit Unions Borrowed More
TOTAL BORROWING & ANNUAL GROWTH
FOR U.S. CREDIT UNIONS | DATA AS OF 12.31.22
© CALLAHAN & ASSOCIATES | CREDITUNIONS.COM
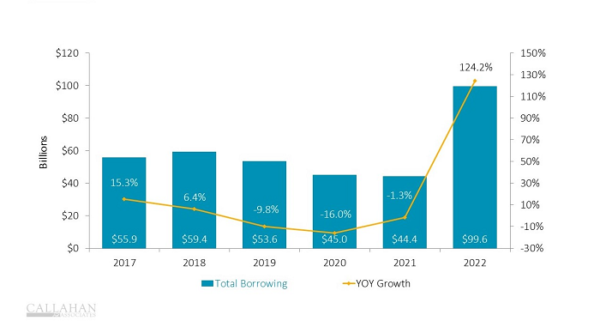
- Credit unions funded 4.6% of their assets with borrowings — more than double the 2.1% from one year ago. However, rising interest rates are making this option more expensive. The cost of borrowing was up 98 basis points from year-end 2021 to 2.93% at year-end 2022.
- Draws from the Federal Home Loan Bank were up 318.2% year-over-year. As of Dec. 31, 434 credit unions had borrowed from the FHLB, up from 102 one year earlier. The number of credit unions with borrowings of any kind reached 1,217, up from 637 the previous year. The average loan-to-share ratio at credit unions with borrowings was 81.8%; it was 57.8% at cooperatives without borrowings.
No. 4: Delinquencies Ticked Up
ASSET QUALITY RATIO
FOR U.S. CREDIT UNIONS | DATA AS OF 12.31.22
© CALLAHAN & ASSOCIATES | CREDITUNIONS.COM
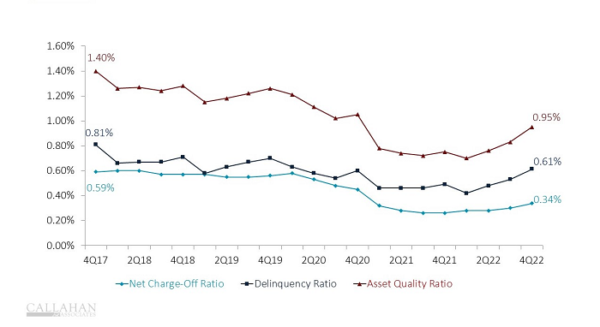
- The asset quality ratio — defined as the net charge-off ratio plus the delinquency ratio — worsened by 20 basis points during the year, settling at 0.95% at year-end. Although charge-offs were still well-below historic norms (0.34%), delinquency returned to its normal range (0.61%). This uptick comes after an era of historically low delinquency, and credit unions have added provisions back to their balance sheets to prepare for loan losses.
- Delinquency increased across all major non-commercial loan types. Credit card (1.18%) and auto (0.67%) loans had the sharpest increases, up 19 and 14 basis points, respectively. Commercial delinquency improved from December 2021, down 9 basis points to 0.33%.
No. 5: Interest Income Drove Revenue Growth
TOTAL REVENUE
FOR U.S. CREDIT UNIONS | DATA AS OF 12.31.22
© CALLAHAN & ASSOCIATES | CREDITUNIONS.COM
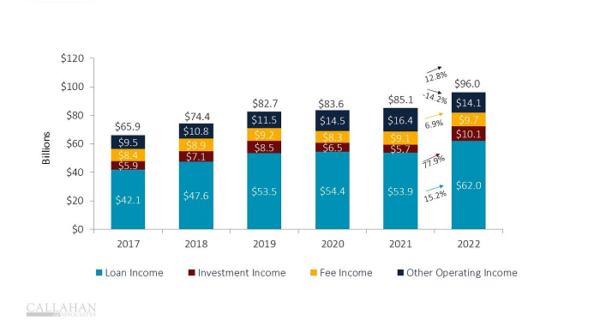
- Credit unions generated 15.2% more income from loans than last year, and investment income topped $10 billion for the first time ever. The yield on investments has been especially good for credit unions; it was up 73 basis points during the year while the loan yield crept up 5 basis points. These rate-sensitive income streams underpinned a 12.8% annual rise in revenue .
- On the non-interest side, a reduction in sales to the secondary market contributed to a 14.2% year-over-year decline in other operating income. Despite the rise in fee income, non-interest income declined 10.4% overall. Holding onto loans for their interest payments will help credit unions become less reliant on non-interest income; however, it will add pressure on liquidity.
How Can Data Power Your Game?
Request A Demo