For much of 2019, it appeared that U.S. and Chinese officials were close to reaching a comprehensive trade agreement, and global risk markets were effectively priced as such. However, things took a turn for the worse in May, sparking a risk-off trade and sending intermediate and long-term Treasury yields more than 35 basis points lower on the month. The shift in investor sentiment was initiated by a tweet from President Trump on May 5. Trump expressed frustration that the talks with China were moving too slowly as they [China] attempt to renegotiate. As a result, he said the United States would be increasing the tariff rate to 25% on more than $500 billion of Chinese imports by the end of the week if China did not meet U.S. demands. This caught investors by surprise and sent risk markets reeling when markets opened that Monday, including a 5% decline in Chinese stocks.
May At-A-Glance
- Market sentiment turned notably bearish in May following a breakdown in U.S./China negotiations.
- The Trump administration also decided to weaponizetrade versus Mexico to affect immigration policy.
- The markets had largely been focused on the inflation trend as it relates to a potential shift in Fed policy, but all eyes are on trade for now.
In the days that followed, there was much analysis as to what caused the sudden shift. With recent U.S. economic data better than expected (Q1 GDP and April jobs report were strong) and stock market performance solid, Trump may have seen an opportunity to push back on criticism that the White House may be relenting on its original demands and accepting a less robust agreement with China. However, Reuters reported that Chinese officials had backtrackedon essentially all major U.S. demands, including intellectual property theft, forced technology transfer, competition policies, and currency manipulation.
The next day the Wall Street Journal presented a theory on why Chinese officials backtrackedon their commitments. According to sources familiar with the thinking of the Chinese side,Beijing interpreted recent statements and actions by President Trump as a sign the U.S. was ready to make concessions. More specifically, Chinese leaders viewed Trump’s badgering of Fed Chair Powell to cut interest rates and expand the Fed balance sheet as evidence that the president thought the U.S. economy was more fragile than he claimed. Why would you be constantly asking the Fed to lower rates if your economy is not turning weak?said Mei Xinyu, analyst at a think tank affiliated with China’s Commerce Ministry. Of course, the Chinese have pushed back on this reasoning, with local media reporting that negotiations collapsed because U.S. officials attempted to add new demands in the final hours of negotiations.
This market overview is provided by ALM First Financial Advisors, LLC, the investment advisor for Trust for Credit Unions. Read more from ALM First about the latest economic data releases and overall market trends at Trustcu.com.
This week, CreditUnions.com shows how the fourth try was the charm for one credit union looking to build a branch in Flint, MI, takes stock of the rise in loan participation activity, contextualizes 2018 mergers, and more.
Here are five can’t-miss data points:
4th
ELGA Credit Union is banking on the fourth try being the charm. Three earlier efforts to open a branch in downtown Flint didn’t pan out, but this time ELGA is already seeing its investment bear fruit in one of America’s most iconic Rust Belt cities. The new facility occupies retail space that had been abandoned for more than 20 years as the birthplace of General Motors went through a prolonged era of decline and decay, but already has become an integral part of the revived business district.
Read: How ELGA Went All In On Downtown Flint
$31.6 Billion
Credit unions have a long history of working together, and the rise in loan participation activity in the past decade shows that willingness to collaborate writ large. The movement’s portfolio of purchased participations at year-end 2018 stood at $31.6 billion, nearly triple of that at the end of 2009. The appeal is simple: participation loans allow lenders to partner with other lenders to reduce risk exposure and increase profits. They help free up capacity, increase liquidity, and reduce concentrations.
Read: Loan Participations: Sharing Risk And Reward
Seven Hours
The drive from Santa Ana to Pleasanton, CA, takes just about seven hours. Erin Mendez knows this because she made the drive nearly six years ago, when she left her post as chief operating officer at SchoolsFirst Federal Credit Union to take over the CEO role at Patelco Credit Union. Before the opportunity arose, Mendez aspired to lead. Just not as CEO. She worked in thrifts and savings banks before joining the credit union industry, where the head leader, to her, was not the CEO. It was the chief operating officer. But when she got to credit unions, she changed her mind. She came to realize that the CEO role was one in which she could affect the most change. And when she took the reins of Patelco in 2013, the opportunity to affect change was immediate.
Read: How A New CEO Watered The Garden And Watched Her Credit Union Bloom
194 Mergers
In 2018, the long-term trend of credit union consolidation continued; still, cooperatives saw strong financial growth as membership expanded to record levels. The credit union industry underwent 194 mergers over the calendar year, bringing the institution count at year-end to 5,492. Ten years ago, 7,697 institutions operated throughout the U.S. and despite 2,205 fewer credit unions in 2018, membership has soared 31.0%. In the midst of financial crisis and the aftermath of the Great Recession, American consumers turned to member-owned financial cooperatives in record numbers for their not-for-profit, member-focused business model.
Read: The Movement’s Mergers Continued In 2018
35 Basis Points
For much of 2019, it appeared that U.S. and Chinese officials were close to reaching a comprehensive trade agreement, and global risk markets were effectively priced as such. However, things took a turn for the worse in May, sparking a risk-off trade and sending intermediate and long-term Treasury yields more than 35 basis points lower on the month. Why?
Read: Breakdown In China Negotiations Sends U.S. Risk Markets Reeling
The first quarter of the year is an opportunity for credit unions to measure early successes and determine whether operational adjustments must be made to ensure the institution will be able to meet strategic goals. Successful business strategies are data-driven and effective performance measurement is the key to unlocking insights that are most relevant to a financial cooperative. With the right combination of metrics, credit unions will be able to identify early indicators of performance so that executives can assess whether strategic adjustments must be made to keep a business on track.
These three metrics will introduce how credit unions benchmark performance in the beginning of the year and how these measures are used to drive strategic decisions:
No. 1: Share Growth
In an industry of tightening liquidity, share growth is crucial to a credit union’s ability to attract deposits that will be used to serve their growing membership base. Share growth, the period-to-period change of total share balances, is a major factor in determining whether a credit union can continue to make loans at the pace the market demands. Therefore, it is important to monitor this ratio relative to marketing efforts for deposit products.
The largest inflows of deposits typically occur in the first quarter of the year and as such, gains in the quarter are highly indicative of a credit union’s ability to serve the lending needs of its membership base. In the first quarter of 2019, Callahan’s analysts projected shares to grow 5.9% year-over-year, driven by growth in share certificates which were projected to have grown 18.2% year-over-year.
SHARE GROWTH
FOR U.S. CREDIT UNIONS | DATA AS OF 12.31.18

Highest gains in share growth nationally was led by credit unions with over $1 Billion in assets.
No. 2: Loan-to-Share Ratio
The relationship between a credit union’s loan and deposit acquisition performance drives its loan-to-share ratio. Financial cooperatives, as a whole, are growing loans at a faster pace than they are able to attract deposits which directly impact their loan-to-share ratio.
The loan-to-share ratio divides the total amount of loans outstanding by the total amount of share deposits at a credit union. Based on early projections by analysts at Callahan and Associates, the loan-to-share ratio national average as of the 1st quarter of 2019 grew to 82.3% compared to 69.1% in the first quarter of 2014. In general, a higher loan-to-share ratio indicates greater profitability. However, as liquidity tightens, credit unions must monitor this ratio to ensure it has sufficient deposits to provide for the lending needs of its growing membership base.
LOAN-TO-SHARE RATIO
FOR U.S. CREDIT UNIONS | DATA AS OF 12.31.18

Loan-to-share ratio in credit unions across all asset bands climbed steadily over the past five years as a result of sustained loan growth.
No. 3: Net Interest Margin
Net interest margin (NIM) is a metric used by credit unions to monitor their ability to sufficiently generate income from loans and investments to cover operating expenses. It is impacted by credit unions’ successful execution of lending, investing, and liquidity strategies. Historically, NIM helps measure and manage an institution’s profitability.
NIM is expressed as a ratio and calculated by total interest income (from loans and investments) less total interest expense (cost of funds from all deposits and borrowings) divided by average assets.
Due to the rising rate environment and growth in overall portfolio size, NIM has grown steadily year-over-year in the past five years. In the first quarter of 2019, NIM was projected at 3.11% compared to 2.80% in the first quarter of 2018. Credit unions should review and identify additional opportunities to continue gains in their investment portfolio yields through liquidity analysis and effective cash flow management.
NET INTEREST MARGIN
FOR U.S. CREDIT UNIONS | DATA AS OF 12.31.18
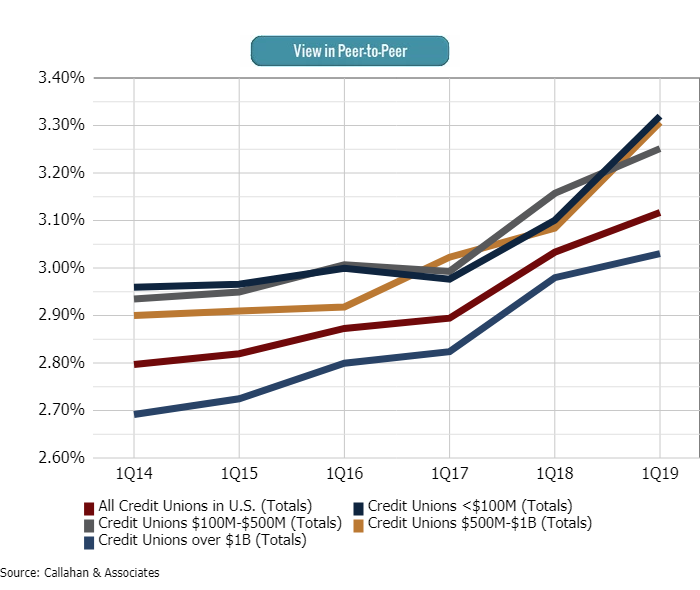
In the past five years, steady growth in NIM was led by credit unions sized $500M-$1B and under $100M in assets.
The metrics above are just a few that financial cooperatives utilize to gain performance and competitive insights. A comprehensive analysis will take these metrics along with other key performance measures such as membership growth, operating expense ratios, and more to provide a holistic view that will drive effective business strategy.
Data presented was based on Callahan and Associates’ first quarter 2019 early look NCUA data as of June 3, 2019.
For much of 2019, it appeared that U.S. and Chinese officials were close to reaching a comprehensive trade agreement, and global risk markets were effectively priced as such. However, things took a turn for the worse in May, sparking a risk-off trade and sending intermediate and long-term Treasury yields more than 35 basis points lower on the month. The shift in investor sentiment was initiated by a tweet from President Trump on May 5. Trump expressed frustration that the talks with China were moving too slowly as they [China] attempt to renegotiate.As a result, he said the United States would be increasing the tariff rate to 25% on more than $500 billion of Chinese imports by the end of the week if China did not meet U.S. demands. This caught investors by surprise and sent risk markets reeling when markets opened that Monday, including a 5% decline in Chinese stocks.
May At-A-Glance
- Market sentiment turned notably bearish in May following a breakdown in U.S./China negotiations.
- The Trump administration also decided to weaponizetrade versus Mexico to affect immigration policy.
- The markets had largely been focused on the inflation trend as it relates to a potential shift in Fed policy, but all eyes are on trade for now.
In the days that followed, there was much analysis as to what caused the sudden shift. With recent U.S. economic data better than expected (Q1 GDP and April jobs report were strong) and stock market performance solid, Trump may have seen an opportunity to push back on criticism that the White House may be relenting on its original demands and accepting a less robust agreement with China. However, Reuters reported that Chinese officials had backtrackedon essentially all major U.S. demands, including intellectual property theft, forced technology transfer, competition policies, and currency manipulation.
The next day the Wall Street Journal presented a theory on why Chinese officials backtrackedon their commitments. According to sources familiar with the thinking of the Chinese side,Beijing interpreted recent statements and actions by President Trump as a sign the U.S. was ready to make concessions. More specifically, Chinese leaders viewed Trump’s badgering of Fed Chair Powell to cut interest rates and expand the Fed balance sheet as evidence that the president thought the U.S. economy was more fragile than he claimed. Why would you be constantly asking the Fed to lower rates if your economy is not turning weak?said Mei Xinyu, analyst at a think tank affiliated with China’s Commerce Ministry. Of course, the Chinese have pushed back on this reasoning, with local media reporting that negotiations collapsed because U.S. officials attempted to add new demands in the final hours of negotiations.
This market overview is provided by ALM First Financial Advisors, LLC, the investment advisor for Trust for Credit Unions. Read more from ALM First about the latest economic data releases and overall market trends at Trustcu.com.
Happy Reading!
Breakdown In China Negotiations Sends U.S. Risk Markets Reeling
For much of 2019, it appeared that U.S. and Chinese officials were close to reaching a comprehensive trade agreement, and global risk markets were effectively priced as such. However, things took a turn for the worse in May, sparking a risk-off trade and sending intermediate and long-term Treasury yields more than 35 basis points lower on the month. The shift in investor sentiment was initiated by a tweet from President Trump on May 5. Trump expressed frustration that the talks with China were moving too slowly as they [China] attempt to renegotiate. As a result, he said the United States would be increasing the tariff rate to 25% on more than $500 billion of Chinese imports by the end of the week if China did not meet U.S. demands. This caught investors by surprise and sent risk markets reeling when markets opened that Monday, including a 5% decline in Chinese stocks.
May At-A-Glance
In the days that followed, there was much analysis as to what caused the sudden shift. With recent U.S. economic data better than expected (Q1 GDP and April jobs report were strong) and stock market performance solid, Trump may have seen an opportunity to push back on criticism that the White House may be relenting on its original demands and accepting a less robust agreement with China. However, Reuters reported that Chinese officials had backtrackedon essentially all major U.S. demands, including intellectual property theft, forced technology transfer, competition policies, and currency manipulation.
The next day the Wall Street Journal presented a theory on why Chinese officials backtrackedon their commitments. According to sources familiar with the thinking of the Chinese side,Beijing interpreted recent statements and actions by President Trump as a sign the U.S. was ready to make concessions. More specifically, Chinese leaders viewed Trump’s badgering of Fed Chair Powell to cut interest rates and expand the Fed balance sheet as evidence that the president thought the U.S. economy was more fragile than he claimed. Why would you be constantly asking the Fed to lower rates if your economy is not turning weak?said Mei Xinyu, analyst at a think tank affiliated with China’s Commerce Ministry. Of course, the Chinese have pushed back on this reasoning, with local media reporting that negotiations collapsed because U.S. officials attempted to add new demands in the final hours of negotiations.
This market overview is provided by ALM First Financial Advisors, LLC, the investment advisor for Trust for Credit Unions. Read more from ALM First about the latest economic data releases and overall market trends at Trustcu.com.
This week, CreditUnions.com shows how the fourth try was the charm for one credit union looking to build a branch in Flint, MI, takes stock of the rise in loan participation activity, contextualizes 2018 mergers, and more.
Here are five can’t-miss data points:
4th
ELGA Credit Union is banking on the fourth try being the charm. Three earlier efforts to open a branch in downtown Flint didn’t pan out, but this time ELGA is already seeing its investment bear fruit in one of America’s most iconic Rust Belt cities. The new facility occupies retail space that had been abandoned for more than 20 years as the birthplace of General Motors went through a prolonged era of decline and decay, but already has become an integral part of the revived business district.
Read: How ELGA Went All In On Downtown Flint
$31.6 Billion
Credit unions have a long history of working together, and the rise in loan participation activity in the past decade shows that willingness to collaborate writ large. The movement’s portfolio of purchased participations at year-end 2018 stood at $31.6 billion, nearly triple of that at the end of 2009. The appeal is simple: participation loans allow lenders to partner with other lenders to reduce risk exposure and increase profits. They help free up capacity, increase liquidity, and reduce concentrations.
Read: Loan Participations: Sharing Risk And Reward
Seven Hours
The drive from Santa Ana to Pleasanton, CA, takes just about seven hours. Erin Mendez knows this because she made the drive nearly six years ago, when she left her post as chief operating officer at SchoolsFirst Federal Credit Union to take over the CEO role at Patelco Credit Union. Before the opportunity arose, Mendez aspired to lead. Just not as CEO. She worked in thrifts and savings banks before joining the credit union industry, where the head leader, to her, was not the CEO. It was the chief operating officer. But when she got to credit unions, she changed her mind. She came to realize that the CEO role was one in which she could affect the most change. And when she took the reins of Patelco in 2013, the opportunity to affect change was immediate.
Read: How A New CEO Watered The Garden And Watched Her Credit Union Bloom
194 Mergers
In 2018, the long-term trend of credit union consolidation continued; still, cooperatives saw strong financial growth as membership expanded to record levels. The credit union industry underwent 194 mergers over the calendar year, bringing the institution count at year-end to 5,492. Ten years ago, 7,697 institutions operated throughout the U.S. and despite 2,205 fewer credit unions in 2018, membership has soared 31.0%. In the midst of financial crisis and the aftermath of the Great Recession, American consumers turned to member-owned financial cooperatives in record numbers for their not-for-profit, member-focused business model.
Read: The Movement’s Mergers Continued In 2018
35 Basis Points
For much of 2019, it appeared that U.S. and Chinese officials were close to reaching a comprehensive trade agreement, and global risk markets were effectively priced as such. However, things took a turn for the worse in May, sparking a risk-off trade and sending intermediate and long-term Treasury yields more than 35 basis points lower on the month. Why?
Read: Breakdown In China Negotiations Sends U.S. Risk Markets Reeling
The first quarter of the year is an opportunity for credit unions to measure early successes and determine whether operational adjustments must be made to ensure the institution will be able to meet strategic goals. Successful business strategies are data-driven and effective performance measurement is the key to unlocking insights that are most relevant to a financial cooperative. With the right combination of metrics, credit unions will be able to identify early indicators of performance so that executives can assess whether strategic adjustments must be made to keep a business on track.
These three metrics will introduce how credit unions benchmark performance in the beginning of the year and how these measures are used to drive strategic decisions:
No. 1: Share Growth
In an industry of tightening liquidity, share growth is crucial to a credit union’s ability to attract deposits that will be used to serve their growing membership base. Share growth, the period-to-period change of total share balances, is a major factor in determining whether a credit union can continue to make loans at the pace the market demands. Therefore, it is important to monitor this ratio relative to marketing efforts for deposit products.
The largest inflows of deposits typically occur in the first quarter of the year and as such, gains in the quarter are highly indicative of a credit union’s ability to serve the lending needs of its membership base. In the first quarter of 2019, Callahan’s analysts projected shares to grow 5.9% year-over-year, driven by growth in share certificates which were projected to have grown 18.2% year-over-year.
SHARE GROWTH
FOR U.S. CREDIT UNIONS | DATA AS OF 12.31.18
Callahan & Associates | CreditUnions.com
Highest gains in share growth nationally was led by credit unions with over $1 Billion in assets.
No. 2: Loan-to-Share Ratio
The relationship between a credit union’s loan and deposit acquisition performance drives its loan-to-share ratio. Financial cooperatives, as a whole, are growing loans at a faster pace than they are able to attract deposits which directly impact their loan-to-share ratio.
The loan-to-share ratio divides the total amount of loans outstanding by the total amount of share deposits at a credit union. Based on early projections by analysts at Callahan and Associates, the loan-to-share ratio national average as of the 1st quarter of 2019 grew to 82.3% compared to 69.1% in the first quarter of 2014. In general, a higher loan-to-share ratio indicates greater profitability. However, as liquidity tightens, credit unions must monitor this ratio to ensure it has sufficient deposits to provide for the lending needs of its growing membership base.
LOAN-TO-SHARE RATIO
FOR U.S. CREDIT UNIONS | DATA AS OF 12.31.18
Callahan & Associates | CreditUnions.com
Loan-to-share ratio in credit unions across all asset bands climbed steadily over the past five years as a result of sustained loan growth.
No. 3: Net Interest Margin
Net interest margin (NIM) is a metric used by credit unions to monitor their ability to sufficiently generate income from loans and investments to cover operating expenses. It is impacted by credit unions’ successful execution of lending, investing, and liquidity strategies. Historically, NIM helps measure and manage an institution’s profitability.
NIM is expressed as a ratio and calculated by total interest income (from loans and investments) less total interest expense (cost of funds from all deposits and borrowings) divided by average assets.
Due to the rising rate environment and growth in overall portfolio size, NIM has grown steadily year-over-year in the past five years. In the first quarter of 2019, NIM was projected at 3.11% compared to 2.80% in the first quarter of 2018. Credit unions should review and identify additional opportunities to continue gains in their investment portfolio yields through liquidity analysis and effective cash flow management.
NET INTEREST MARGIN
FOR U.S. CREDIT UNIONS | DATA AS OF 12.31.18
Callahan & Associates | CreditUnions.com
In the past five years, steady growth in NIM was led by credit unions sized $500M-$1B and under $100M in assets.
The metrics above are just a few that financial cooperatives utilize to gain performance and competitive insights. A comprehensive analysis will take these metrics along with other key performance measures such as membership growth, operating expense ratios, and more to provide a holistic view that will drive effective business strategy.
Data presented was based on Callahan and Associates’ first quarter 2019 early look NCUA data as of June 3, 2019.
For much of 2019, it appeared that U.S. and Chinese officials were close to reaching a comprehensive trade agreement, and global risk markets were effectively priced as such. However, things took a turn for the worse in May, sparking a risk-off trade and sending intermediate and long-term Treasury yields more than 35 basis points lower on the month. The shift in investor sentiment was initiated by a tweet from President Trump on May 5. Trump expressed frustration that the talks with China were moving too slowly as they [China] attempt to renegotiate.As a result, he said the United States would be increasing the tariff rate to 25% on more than $500 billion of Chinese imports by the end of the week if China did not meet U.S. demands. This caught investors by surprise and sent risk markets reeling when markets opened that Monday, including a 5% decline in Chinese stocks.
May At-A-Glance
In the days that followed, there was much analysis as to what caused the sudden shift. With recent U.S. economic data better than expected (Q1 GDP and April jobs report were strong) and stock market performance solid, Trump may have seen an opportunity to push back on criticism that the White House may be relenting on its original demands and accepting a less robust agreement with China. However, Reuters reported that Chinese officials had backtrackedon essentially all major U.S. demands, including intellectual property theft, forced technology transfer, competition policies, and currency manipulation.
The next day the Wall Street Journal presented a theory on why Chinese officials backtrackedon their commitments. According to sources familiar with the thinking of the Chinese side,Beijing interpreted recent statements and actions by President Trump as a sign the U.S. was ready to make concessions. More specifically, Chinese leaders viewed Trump’s badgering of Fed Chair Powell to cut interest rates and expand the Fed balance sheet as evidence that the president thought the U.S. economy was more fragile than he claimed. Why would you be constantly asking the Fed to lower rates if your economy is not turning weak?said Mei Xinyu, analyst at a think tank affiliated with China’s Commerce Ministry. Of course, the Chinese have pushed back on this reasoning, with local media reporting that negotiations collapsed because U.S. officials attempted to add new demands in the final hours of negotiations.
This market overview is provided by ALM First Financial Advisors, LLC, the investment advisor for Trust for Credit Unions. Read more from ALM First about the latest economic data releases and overall market trends at Trustcu.com.
Happy Reading!
Daily Dose Of Industry Insights
Stay informed, inspired, and connected with the latest trends and best practices in the credit union industry by subscribing to the free CreditUnions.com newsletter.
Share this Post
Latest Articles
AI Boot Camp Is More Than Basic Training At Clearview FCU
Stable Economy. Strained Households.
Fintech Grounded In Mission As Much As Market Opportunity
Keep Reading
Related Posts
Connection And Caring Matter As Much As Knowledge And Resources
Markets Flip From Pricing Cuts To 50% Chance Of Hikes
New Highs For Equity Markets Despite Iran And Oil Prices
AI Boot Camp Is More Than Basic Training At Clearview FCU
Aaron PassmanStable Economy. Strained Households.
Andrew LepczykFintech Grounded In Mission As Much As Market Opportunity
Marc RapportView all posts in:
More on: