When it comes to financial transactions, consumers want enhanced services that are easy to use. Credit unions that can meet this expectation have the potential to build strong member relationships that can translate into improved financial performance across a range of measures.
In 2015, Callahan Associates analyzed the performance of credit unions with less than $100 million in assets that also offered all of the following technological options to members:
- Mobile banking.
- Remote deposit capture.
- Electronic signature authentication.
- Electronic bill pay.
- Electronic member application.
- Electronic loan application.
- Electronic share account application.
The following charts compare this base group’s performance (CUs ‘$100M With Strong Tech Offering) against similarly sized peers (CUs ‘$100M Excluding Strong Tech) as well as the next largest asset group (CUs $100M-$250M). Interestingly, credit unions with strong technology offerings post averages that outperform not only their asset-based peers but also, at times, their larger peers.
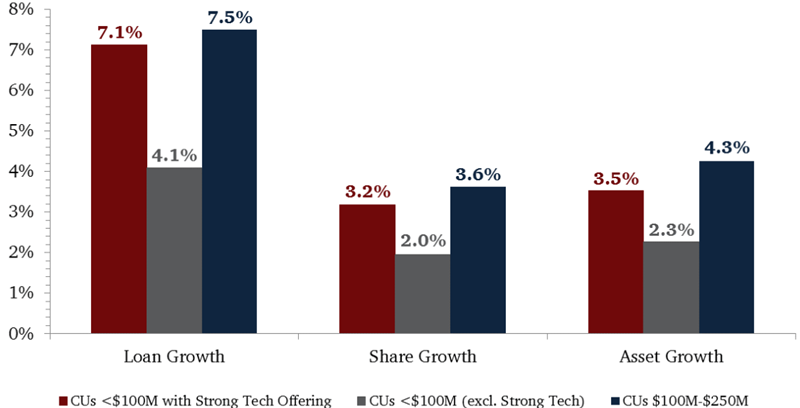
Growth Comparison
For all U.S. credit unions | Data as of Dec. 31
Callahan Associates |www.creditunions.com
Source: Peer-to-Peer Analytics by Callahan Associates
Credit unions with strong technology offerings posted significantly better growth rates than similarly sized credit unions with weaker technology offerings at year-end 2014. Although technologically strong credit unions posted lower growth rates than the institutions with $100-$250 million in assets, their financial performance is more in line with the larger peer group.
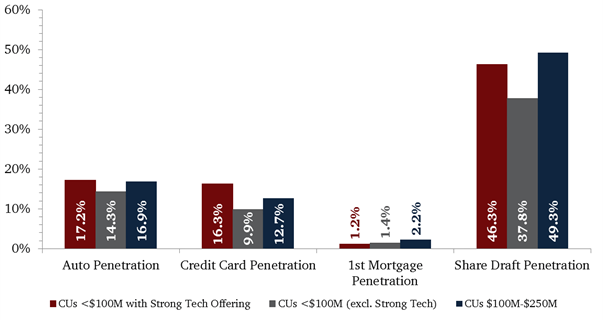
Product Penetration Comparison
For all U.S. credit unions | Data as of Dec. 31
Callahan Associates |www.creditunions.com
Source: Peer-to-Peer Analytics by Callahan Associates
Technologically strong credit unions tended to have stronger product penetration for both auto and credit card products than credit unions in both comparative peer groups. However, credit unions with $100-$250 million in assets outperformed even technologically strong credit unions in first mortgage and share draft penetration.
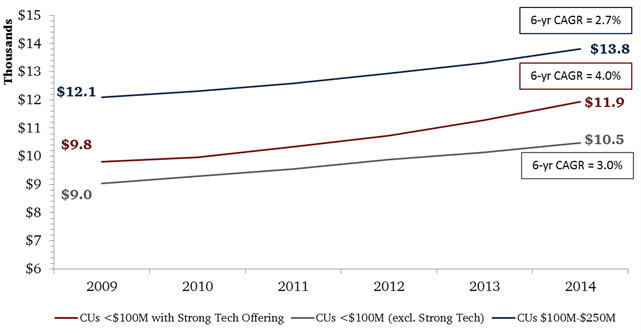
Average Member Relationship
For all U.S. credit unions | Data as of Dec. 31
Callahan Associates |www.creditunions.com
Source: Peer-to-Peer Analytics by Callahan Associates
When it comes to average member relationship which measures the average loan and share amount members have with their credit union the technologically strong peer group has increased the value of its member relationships faster than both its asset-based peers as well as its larger $100M-$250M peers, over the past six years.
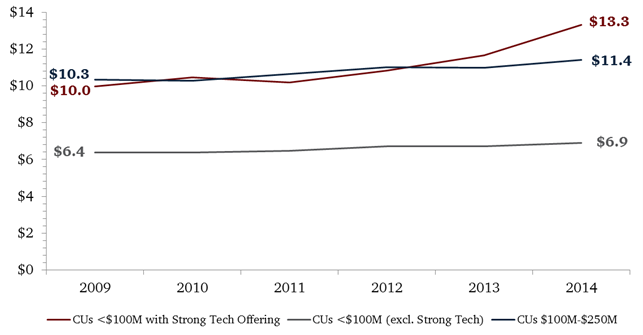
Marketing Expenditure Per Member
For all U.S. credit unions | Data as of Dec. 31
Callahan Associates |www.creditunions.com
Source: Peer-to-Peer Analytics by Callahan Associates
Comparing the different peer groups based on marketing expenditure per member reveals that historically, the technologically strong group and the larger $100M-$250M group spent roughly the same amount on marketing expenses per member. However, in recent years, the technologically strong group has increased its marketing expenditures, while the lower technology and larger peer group have stayed flat.
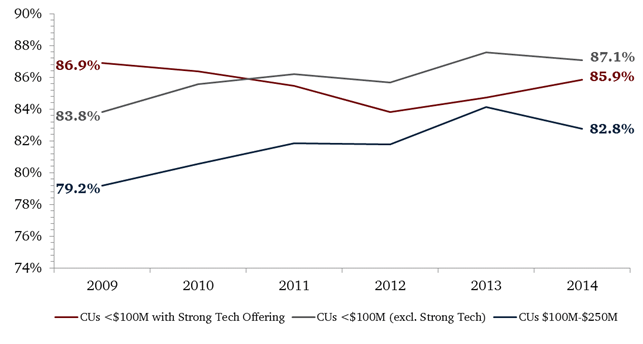
Efficiency Ratio
For all U.S. credit unions | Data as of Dec. 31
Callahan Associates |www.creditunions.com
Source: Peer-to-Peer Analytics by Callahan Associates
By comparing the peer groups based on their efficiency ratios we can glean a better understanding of the relationship between their expenses and income. Generally, the efficiency ratio measures how much the credit union spends to create $1 of revenue. Typically, the lower the efficiency ratio, the better. As credit unions increase their asset base, their efficiency ratios tend to decrease as they are able to achieve greater efficiencies through scale. As seen above, the technologically strong group is able to operate more profitably than its similar-sized peers, presumably as a result of more streamlined and efficient operational models.
This article originally appeared on CreditUnions.com on June 08, 2015.