Credit unions report non-interest income as fee income and other operating income on the 5300 Call Report. Unfortunately, these two broad categories do little to shed light on what is happening within the countless subcomponents that comprise the overall totals.
In May 2020, Callahan & Associates introduced the data upload tool to its flagship Peer-to-Peer program. Using this new feature, credit unions can upload data beyond the traditional fields found on the 5300 Call Report. For the past six months, Callahan has collaborated with credit unions across the country to gather non-interest income data and gain deeper insights than ever before. [Editor’s Note: CreditUnions.com is a property of Callahan & Associates].
Using the upload tool, nearly 150 credit unions have shared data and can view data from other organizations that also have shared for 25 different non-interest income subcategories, including NSF/overdraft fees, loan origination fees, card fees, and interchange income. To gain deeper insight into interchange income, Callahan analysts standardized reporting through June 30, 2020, limiting the sample size to 112 credit unions representing 10.6% of the industry’s assets.
Interchange income the revenue a credit union earns from a business every time a member swipes a card to make a payment comes from debit cards, credit cards, and ATM/POS transactions. Historically, it has been the backbone of the other operating income category.
For the credit unions in the Callahan sample, interchange income has comprised more than two-thirds of all other operating income for the past five years. However, a recent surge in revenue from mortgage sales coupled with a pullback in consumer spending pushed down the share of interchange income to 59.8% of other operating income as of June 30. That’s a decline of 11.6 percentage points from the first six months of 2019.
One hundred and seven credit unions in the Callahan sample offer a credit card product; however, the 2.1 million credit card accounts across the peer group are dwarfed by the 7.4 million share draft accounts and their corresponding debit cards. In the Callahan sample, roughly 66% of interchange income during the first six months of 2020 came from debit cards and approximately 25% from credit cards. Debit card interchange income rose 1.7% annually, whereas credit card interchange income fell 11.9%. This is indicative of the change in consumer spending patterns and attitudes toward debt.
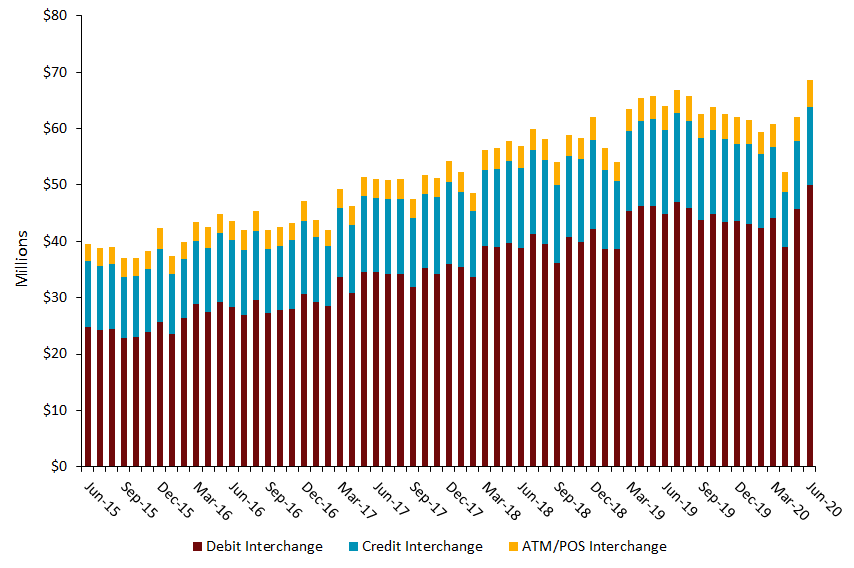
TOTAL INTERCHANGE EARNINGS BY MONTH
FOR 112 PARTICIPATING CREDIT UNIONS | DATA AS OF 06.30.20
SOURCE: Callahan & Associates

The impact of widespread quarantines and lockdowns in April is clear. That’s the worst month for interchange income generation in nearly two years for the credit unions in the Callahan sample. A record June helped keep year-to-date interchange income flat year-over-year.
Overall, interchange income fell 1.3% year-over-year to $364.6 million as of June 30. Experts predicted a more dramatic decline in this metric given the nationwide quarantines and related spending contraction, so credit union interchange revenue did exceed expectations. However, it is worth noting the second quarter of 2020 marked the first year-over-year decline in this metric in the Callahan sample. Credit unions reported double-digit annual growth in nearly all previous months. The shake-up in interchange income is clear evidence of the impact COVID-19 has had on economic transactions.
Want to learn more about what’s happening in other non-interest income subcategories? Interested in customizing a report for your own credit union? Other credit unions have used Callahan’s new data sharing tool to adjust their business models to a changing environment, and you can, too. Click here to learn how to share your non-interest income data in Peer-to-Peer and start benefitting from the power of credit union collaboration today.