Absent additional stimulus and a modest uptick in loan demand, investment balances fell accordingly in the second quarter. Total investments declined 0.4% or -$2.9 billion from the first to second quarter and totaled $699.9 billion at midyear. In contrast to recent trends and despite a twisting yield curve two- to five-year note yields moving higher and longer-dated yields lower following the June FOMC meeting cash balances contracted 11.1% from March 31 as credit unions actively put money to work. Accordingly, investments in securities and certificates expanded at a strong linked quarter rate of 7.6%.
The quarterly change in net liquidity for the industry defined as the change in share balances less change in loan balances was negative for the first time since September 30, 2019, as loan demand, notably vehicle lending, gained steam. First mortgages again accounted for the lion’s share of growth in the loan portfolio. That segment was up 2.7% from March 31; however, auto lending came in a close second with balances up 2.1% on the quarter.
TOTAL INVESTMENTS AND QUARTERLY GROWTH
FOR U.S. CREDIT UNIONS | DATA AS OF 06.30.21

Industry yield ticked up slightly as cash holdings declined at U.S. credit unions.
The average yield on investments increased 2 basis points in the second quarter of 2021, rising to 0.85% by June 30. This marks the first quarterly increase since the third quarter of 2019 when the average yield was 2.42%. Moderate portfolio extension and a decline in minimally earning cash contributed to the gain.
YIELD ON INVESTMENTS
FOR U.S. CREDIT UNIONS | DATA AS OF 06.30.21

Credit unions rework their portfolios to add duration in the second quarter.
Fixed income yields traded in a tighter range across much of the second quarter after the spike in yields in the first quarter overwhelmed the impact of tighter spreads over much of the ensuing period. The Fed’s June 16 FOMC meeting changed the calculus for many as the quarter neared a close.
The hawkish sentiment from the meeting notes, specifically timing for a rate increase, pulled forward expectations for repricing, which caused the yield curve to twist around the five-year mark. Yields in the two- to five-year maturity range moved higher while longer-dated yields fell. Excess liquidity returned by the Fed’s balance sheet and U.S. fiscal policy, combined with a shrinking pool of investible assets, pushed short-term and money market rates to all-time lows. The Fed’s technical adjustments to IOER and the reverse repurchase facility offering rate both increased 0.05% at the June meeting should alleviate some of the downward pressure on rates at the front-end of the curve, but it is not a long-term solution as the supply/demand imbalance, among other challenges, remains an issue.
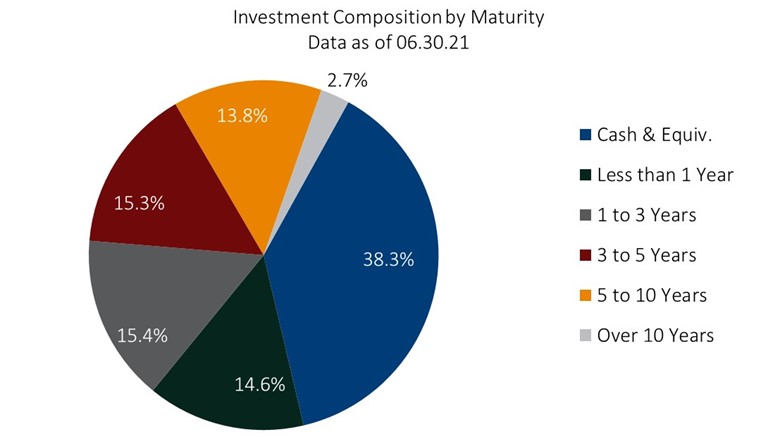
At credit unions, a decline in cash holdings and an uptick in investing activity led maturities of investment portfolios to lengthen across the second quarter. Investments continue to be targeted at the belly of the curve three to seven years where yield spreads were the widest. Every maturity segment of securities expanded from the first quarter. The largest growth in percentage was seen in investments maturing in three to five years. This segment increased $17.8 billion, or 20.0%, from March 31 and accounted for 58.2% of quarterly investment balance growth. Similarly, investments maturing in five to 10 years grew 10.2% across the quarter, contributing 29.1% to portfolio growth.
INVESTMENT COMPOSITION BY MATURITY
FOR U.S. CREDIT UNIONS | DATA AS OF 06.30.21
Government and agency holdings drove portfolio gains at credit unions.
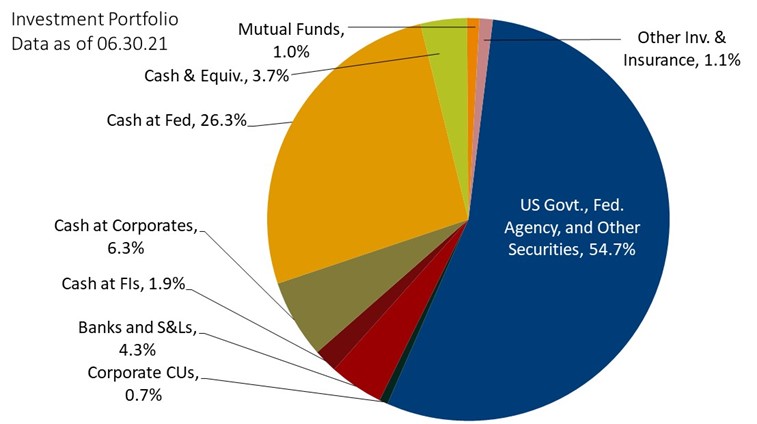
Cash and investment balances fell $2.9 billion to finish the quarter at $699.9 billion. The primary driver of the net decline was an 11.1% reduction in cash balances at credit unions across the country. Securities and investments, on the other hand, grew 7.6%. Credit unions deployed the majority of funds to Federal agency securities MBS (56.7%), non-MBS (14.9%), and U.S. government obligations (19.5%).
In aggregate, credit unions reported $241.7 billion in overnight cash balances, including $184.2 billion at the Fed and $44.1 billion at corporate credit unions. Cash on deposit fell across all segments, with Fed and corporate credit union balances down 10.8% and 16.0%, respectively, quarter-over-quarter.
Successful cash deployment strategies translated to a reduction in cash as a percentage of total investments, which fell to 38.3% of total balances in the second quarter. From 2016 to 2019, the average industry cash allocation was 28.6%; it spiked in the first quarter of 2020.
With the exception of bank notes and cash, every major segment of the investment portfolio expanded on a linked quarter basis. U.S. government obligations posted the largest percentage increase in the quarter, 19.6%, as many investors looked out on the curve when rates initially surged in the late winter and early spring months. Mutual funds posted the second-largest percentage gain, up 12.2%, from a combination of inflows to traditional investments and executive benefit pre-funding accounts. The largest gain in dollars was, again, Federal agency MBS debt, which expanded 8.9%, or $17.3 billion.
CREDIT UNION INVESTMENT PORTFOLIO
FOR U.S. CREDIT UNIONS | DATA AS OF 06.30.21
Portfolios lengthened for the fifth consecutive quarter.
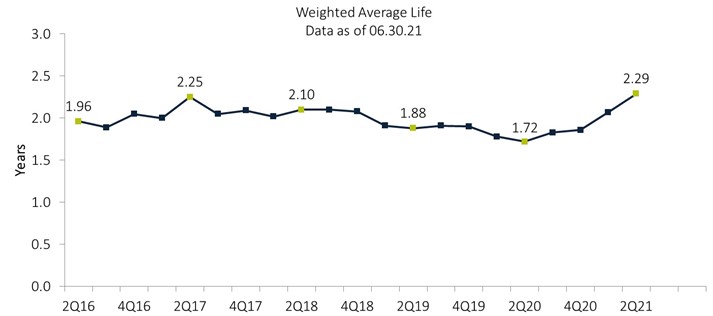
Thanks to a shift in portfolio composition, the weighted average life of all credit union investments as of June 30, 2021, was 2.29 years, up from 2.07 years one quarter ago. Specifically, an increase in securities with longer maturities five to 10 years was up 10.2% quarterly and an 11.1% decline in cash and equivalents helped to extend the weighted average life of the industry investment portfolio.
WEIGHTED AVERAGE LIFE
FOR U.S. CREDIT UNIONS | DATA AS OF 06.30.21
Notional balances fell just shy of the record high.
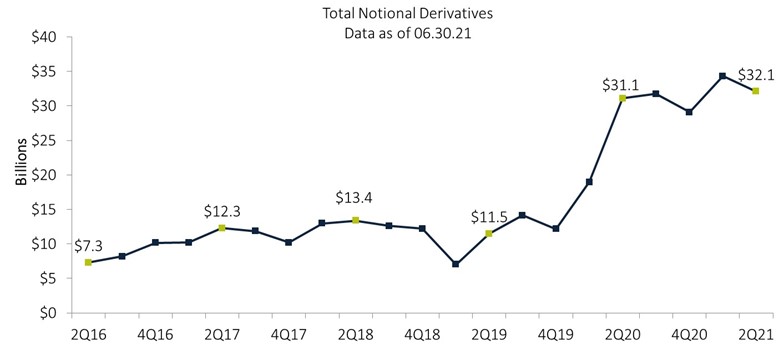
Notional balances increased 3.2% year-over-year to reach $32.1 billion at midyear. This is just off the all-time high of $34.3 billion set in the first quarter.
Despite the quarterly decline in derivative balances, the number of credit unions that reported derivative usage rose by five institutions, up from 84 in the first quarter to 89 in the second quarter of 2021. On an annual basis, the total number of participating credit unions rose by 11 as institutions increasingly looked to derivatives to manage evolving risk profiles and a changing rate environment.
Derivative usage remains expected to increase in future periods following the NCUA board’s May 20 approval to finalize updates to modernize its derivatives rule that makes usage more principals-based and enables smaller credit unions to use simple derivatives to hedge their loan portfolios.
TOTAL NOTIONAL DERIVATIVES
FOR U.S. CREDIT UNIONS | DATA AS OF 06.30.21
Notional derivatives dipped slightly from the previous quarter.
If you would like to compare your own institution to the industry benchmark or a specific peer group, please contact Trust For Credit Unions at 800-237-5678 or TCUgroup@callahan.com.
About Trust For Credit Unions
Trust for Credit Unions (TCU) helps credit unions succeed in serving their members by providing a professionally managed family of mutual funds — exclusive to credit unions — as well as the information and analysis they need to support investment decisions. Created by some of the leading credit unions with oversight by a board of trustees, TCU’s mutual fund options allow credit unions to meet their short duration needs, are professionally managed, and are based on the cooperative values of credit unions.
Visit www.trustcu.com or call us at 800-237-5678 to learn more.
The Trust for Credit Unions (TCU) is a family of institutional mutual funds offered exclusively to credit unions. Callahan Financial Services is a wholly owned subsidiary of Callahan & Associates and is the distributor of the TCU mutual funds. ALM First Financial Advisors, LLC, is the investment advisor of TCU mutual funds. To obtain a prospectus that contains detailed fund information including investment policies, risk considerations, charges, and expenses, call Callahan Financial Services, Inc., at 800-CFS- 5678. Please read the prospectus carefully before investing or sending money. Units of the Trust portfolios are not endorsed by, insured by, obligations of, or otherwise supported by the U.S. Government, the NCUSIF, the NCUA, or any other governmental agency. An investment in the portfolios involves risk, including possible loss of principal.