Credit union performance in the first three months of 2021 varied across the industry balance sheet, with some bright spots giving optimism for a near-term return to normalcy. However, new challenges emerged, and existing headwinds lingered.
A third round of relief payments combined with the seasonal spike in share inflows translated to annual deposit growth of 22.7%. From year-end 2020, share balances rose 6.4%, compared with 4.3% quarterly growth a year ago. Given the scale and atypical growth drivers that have transformed credit union balance sheets over the past 12-months, it is important to contextualize this growth and recognize how different segments of the balance sheet are changing in relation to one another.
Investment Balances Surpass $700 Billion
Following the dramatic gains in the deposit portfolio, investment balances rose accordingly. On a quarterly basis, total investments surged 16.4% (+$98.9 billion) from December to March and totaled $700.8 billion at quarter-end.
Continuing recent trends, the combination of a limited supply of short-term bonds, modest yields, and a persistent uncertainty about deposit retention assumptions translated to quarterly cash balance growth of 23.4% from December, which was up 81.9% year-over-year. Investments in securities and certificates expanded at a slower yet historically strong linked quarter pace of 11.7% as investment officers worked double-time to put money to work.
Loan demand again failed to match the scale of deposit growth in the first quarter as low rates and government payments contributed to higher portfolio churn in the form of paydowns and refinancings.
First mortgages powered balance sheet growth in the loan portfolio, up 0.8% from December while auto balances were flat on the quarter. After bouncing back in the third quarter of 2020, new challenges emerged in the early months of 2021. A global chip supply shortage continues to disrupt new vehicle supply chains and has accelerated competition and pricing in the used vehicle market.
TOTAL CREDIT UNION INVESTMENTS AND QUARTERLY GROWTH
FOR U.S. CREDIT UNIONS | DATA AS OF 03.31.21
Callahan & Associates | CreditUnions.com
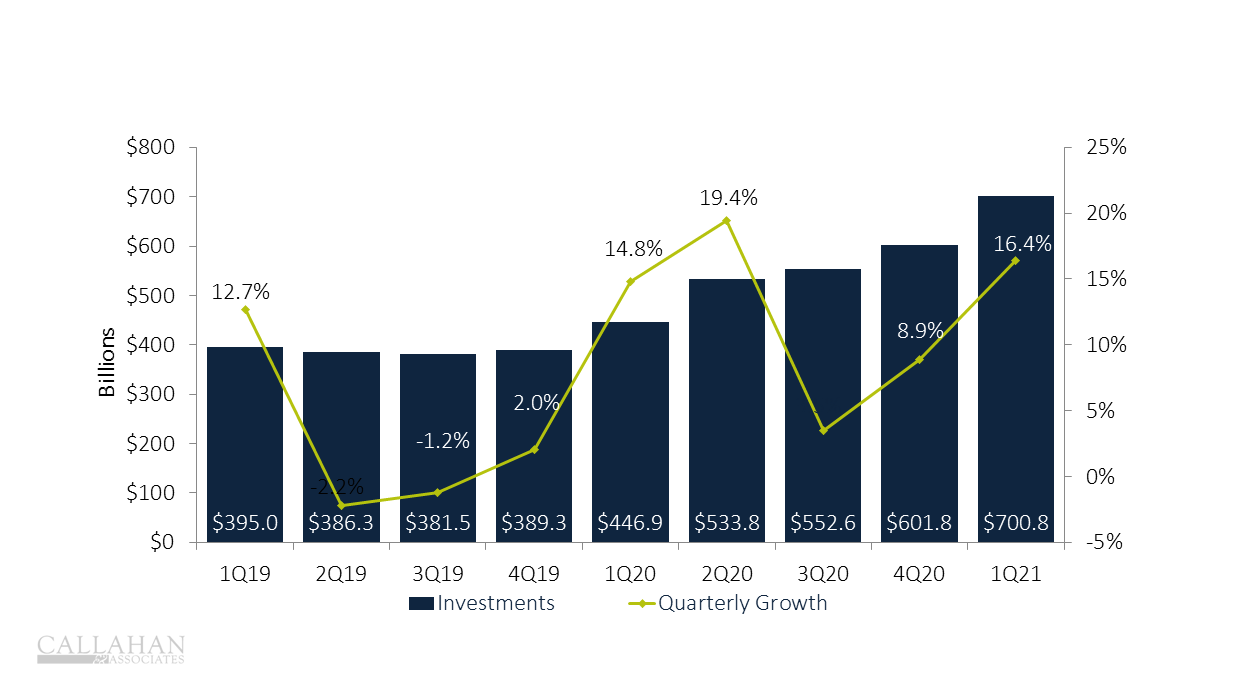
Loan demand again failed to match the scale of deposit growth in the first quarter. Following the dramatic gains in the deposit portfolio, investment balances rose accordingly.
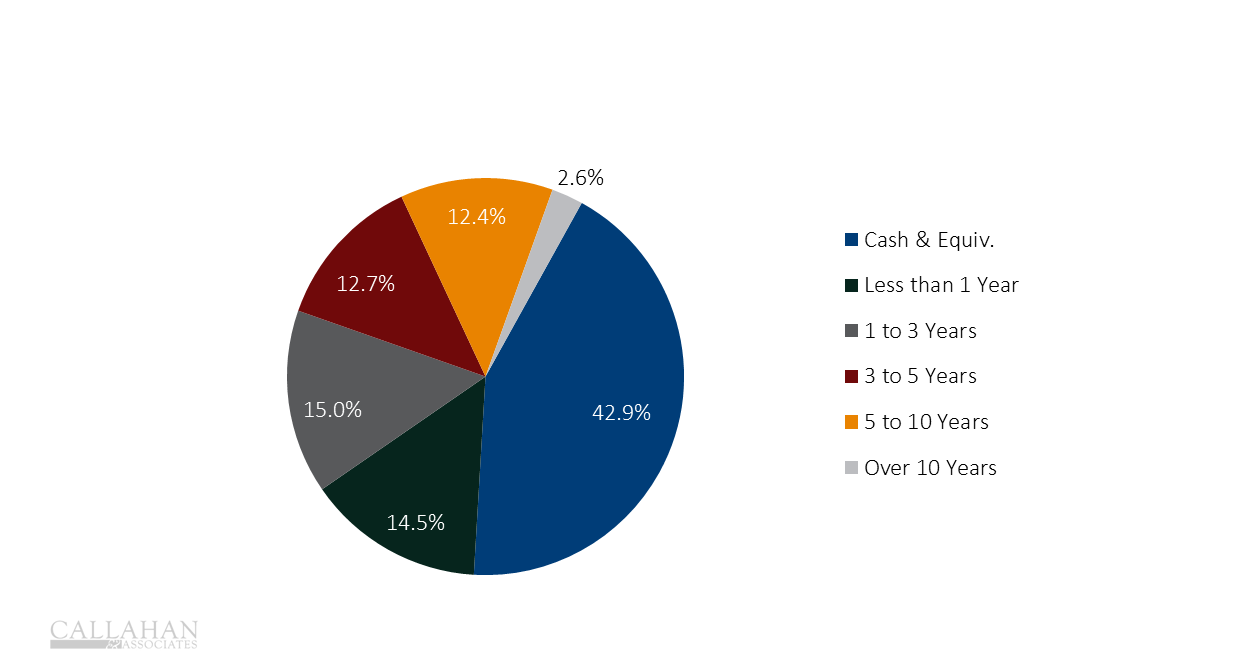
Mutual Funds Record Robust Growth And Agencies Surge
Cash and investment balances rose $98.9 billion to surpass $700 billion at the end of the first quarter. This is the largest quarterly gain on record and surpasses even the $86.9 billion increase in the second quarter of 2020.
Keeping with recent trends, overnight cash balances accounted for 61.7% of quarterly growth, although that’s down from the 65.4% contribution in the fourth quarter. Credit unions primarily deployed the remainder of new investment dollars to Federal agency securities MBS (23.1%) and non-MBS (9.5%). In aggregate, credit unions reported $273.1 billion in overnight cash balances, including $205.9 billion at the Fed and $52.3 billion at corporate credit unions. That’s a quarter-over-quarter expansion of 33.3% and 17.6%, respectively.
Despite best efforts, cash as a percentage of total investments increased again in the first quarter to 42.9% of total balances. This is the highest level on record and bests the prior 40.6% high set in the second quarter of 2020.
With the exception of bank notes, every major segment of the investment portfolio expanded on a linked quarter basis. Mutual fund investments again posted the largest percentage increase in the quarter, 26.1%, due to an uptick in adoption rates and ease-of-use for deploying cash at scale. The largest gain in dollars was Federal agency debt, with MBS investments expanding 13.4% ($22.9 billion) and non-MBS securities growing 15.6% ($9.4 billion).
INVESTMENT PORTFOLIO COMPOSITION
FOR U.S. CREDIT UNIONS | DATA AS OF 03.31.21
Callahan & Associates | CreditUnions.com

With the exception of bank notes, every major segment of the investment portfolio expanded on a linked quarter basis.
Credit Unions Lean Into Duration
The third round of relief payments contributed to a persistent supply-demand mismatch in the short-term fixed income space as more financial institutions, and dollars, competed for securities in the pursuit of balanced liquidity deployment strategies. As a result, treasury yields two years and fewer grinded tighter despite the sharp steepening of intermediate and long-end yields across the quarter.
In general, maturities of investment portfolios at U.S. credit unions lengthened in the first quarter of 2021 despite the 23.4% quarterly increase in cash balances. With short-term investments delivering marginal returns, credit unions sought to deliberately take advantage of the yield curve steepening. As such, they targeted investments in the belly of the curve three to seven years where yield spreads were the widest.
Once again, every segment except for securities maturing in one to three years expanded from the fourth quarter. Outside of cash, the largest growth in percentage terms and balances occurred in investments maturing in five to 10 years. This segment increased $32.7 billion, or 60.1%, from December and accounted for two-thirds of quarterly investment balance growth. Similarly, investments maturing in three to five years grew 18.1% across the quarter, contributing 27.7% to portfolio growth.
INVESTMENT COMPOSITION BY MATURITY
FOR U.S. CREDIT UNIONS | DATA AS OF 03.31.21
Callahan & Associates | CreditUnions.com
In general, maturities of investment portfolios at U.S. credit unions lengthened in the first quarter of 2021.
Industry Yield Hits Record Low; Excess Cash And Reinvestment Weigh Heavy
The average yield on investments declined 52 basis points in the first quarter of 2021, falling to 0.83% by the end of March. This marks the lowest yield on record by a sizable margin the prior low was 1.07% in March 2013. Despite modest portfolio extension, record low reinvestment rates and the 42.9% industry cash allocation offset the nominal gains resulting from the incremental duration addition.
From a portfolio earnings perspective, investment income in the first quarter totaled nearly $1.3 billion, down 14.7% from the fourth quarter and 15.4% year-over-year.
YIELD ON INVESTMENTS
FOR U.S. CREDIT UNIONS | DATA AS OF 03.31.21
Callahan & Associates | CreditUnions.com
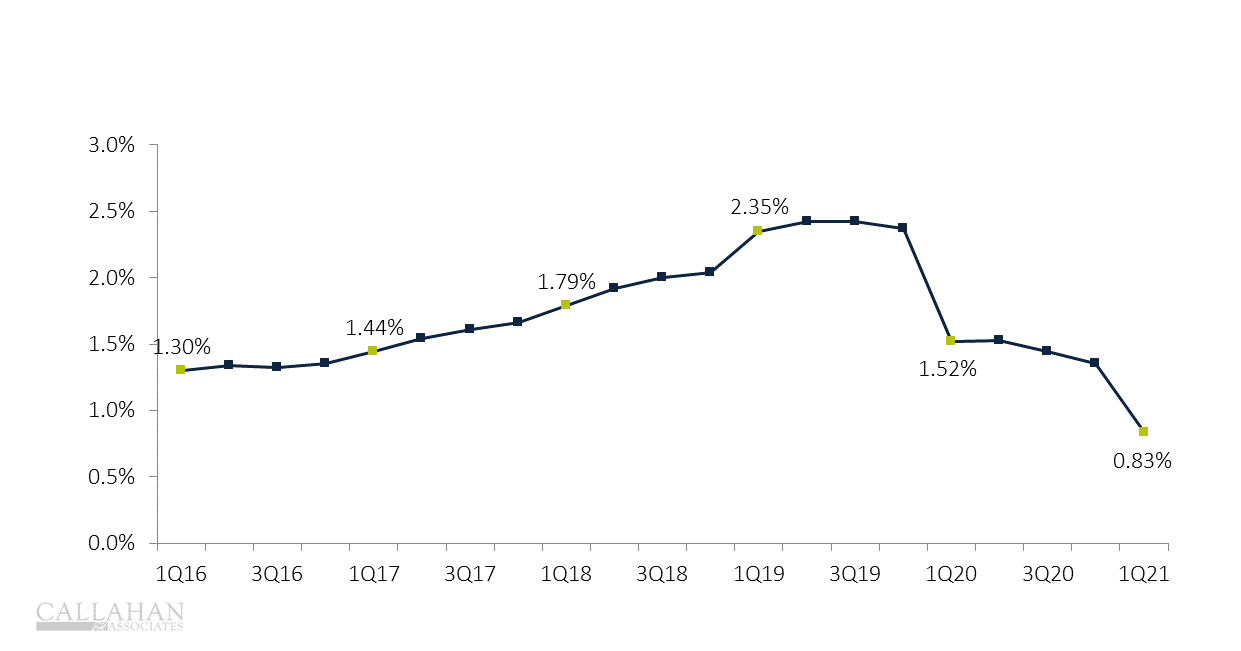
From a portfolio earnings perspective, investment income in the first quarter was down from the fourth quarter and year-over-year.
Portfolios Lengthen For The Fourth Consecutive Quarter
As of March 31, the weighted average life of all credit union investments was 2.07 years, up from 1.86 years in December thanks to a shift in portfolio composition. Specifically, an increase in securities with longer maturities five to 10 years was up 60.1% and greater than 10 years was up 36.1% quarterly outweighed the 23.4% increase in cash and equivalents to extend the weighted average life of the industry investment portfolio.
WEIGHTED AVERAGE LIFE
FOR U.S. CREDIT UNIONS | DATA AS OF 03.31.21
Callahan & Associates | CreditUnions.com
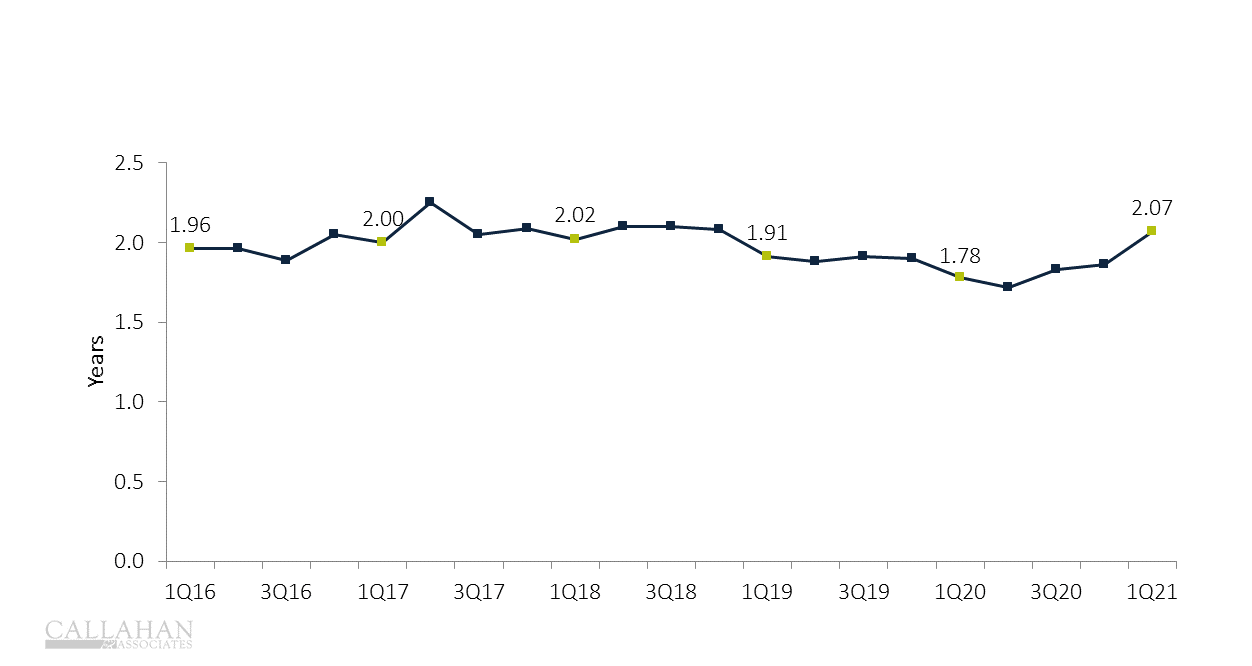
Thanks to a shift in portfolio composition specifically, an increase in securities with longer maturities the weighted average life of all credit union investments ticked up from 1.86 years in December to 2.07 years in March.
Notional Balances Hit Record High
Notional balances increased 81.2% year-over-year to reach $34.3 billion in March. This all-time high represents a quarterly increase of $5.2 billion.
Corresponding with the quarterly increase in derivative balances, the number of credit unions that reported derivative usage rose by two institutions, up from 82 in the fourth quarter to 84 in the first quarter of 2021. On an annual basis, the total number of participating credit unions rose by eight, as institutions increasingly looked to derivatives to manage evolving risk profiles.
Derivative usage is expected to increase in future periods following the NCUA Board’s May 20 approval to finalize updates to modernize its derivatives rule that makes usage more principals-based and enables smaller credit unions to use simple derivatives to hedge their loan portfolios.
TOTAL NOTIONAL DERIVATIVES
FOR U.S. CREDIT UNIONS | DATA AS OF 03.31.21
Callahan & Associates | CreditUnions.com
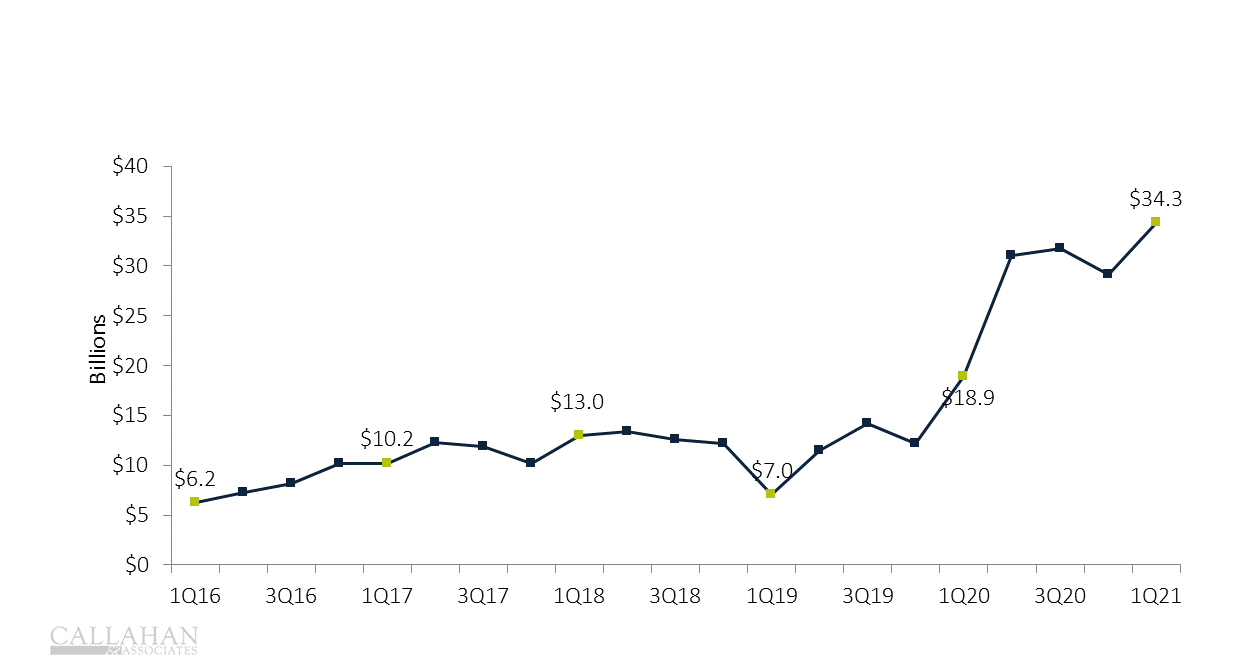
Corresponding with the increase in derivative balances, the number of credit unions that reported derivative usage rose by two institutions quarter-over-quarter and eight institutions year-over-year.
Sam Taft is the associate vice president of analytics at Callahan & Associates. He also leads the business development efforts for the Trust for Credit Unions family of mutual funds, of which Callahan Financial Services (a broker dealer subsidiary of Callahan & Associates) is the distributor.