Investments are unseasonably trending up, at a projected $371.5 billion for the third quarter of 2016. This is the first time in five years that credit union investments were higher in the third quarter than the second. In fact, trend data from the past 10 years shows investments usually drop from the second quarter to the third.
Consider the graph below, which maps total investments (less cash on hand) over the past ten years. The color intensifies the closer it is to the present (i.e., the darkest red line is 2016), and you are invited to hover over the data points to gather more information on each data point or change the year filter to concentrate on a different year.
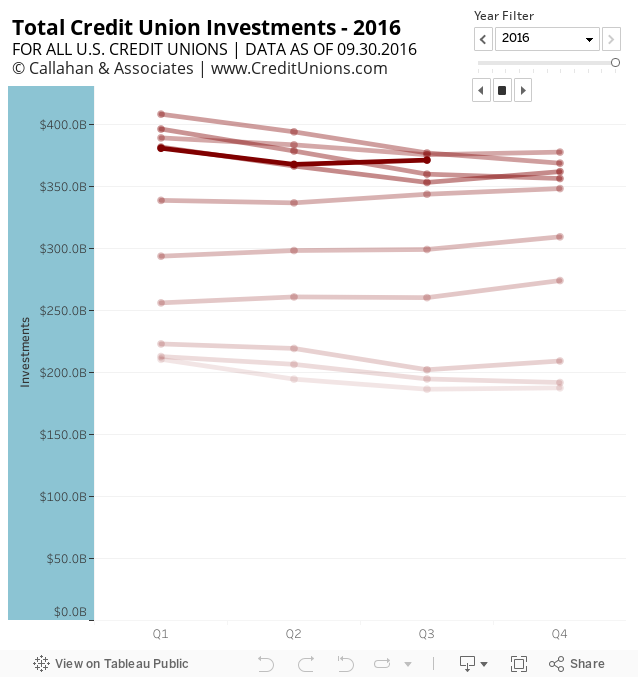
Investments less cash on hand are up 1.0% quarter-over-quarter. Even though cash on hand is subtracted from the investment numbers above, cash at corporates and cash at other financial institutions are on the rise.
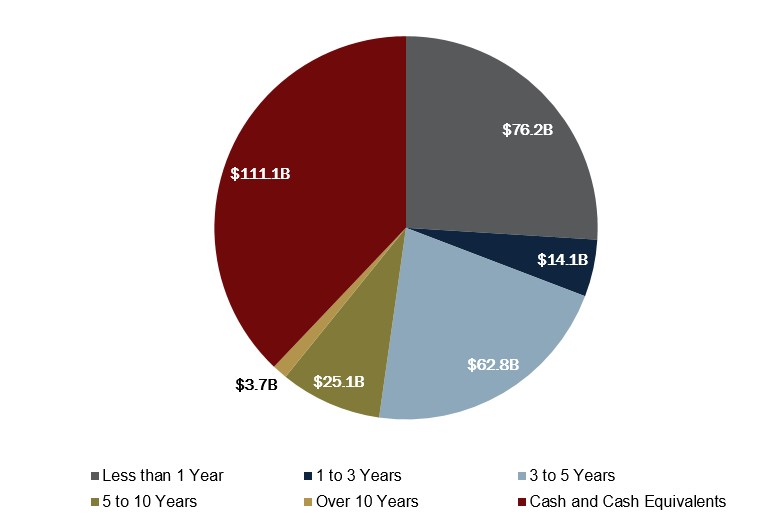
Overall, short term investments are on the rise in the industry. Cash and cash equivalents are up 7.8% quarter-over-quarter and investments less than a year are up 1.6% in the same amount of time. Long-term investments are generally down, except for investments between 5 to 10 years, which increase 3 basis points from the second quarter.
INVESTMENT MATURITY
FOR U.S. CREDIT UNIONS* | DATA AS OF 09.30.16
Callahan Associates | www.creditunions.com
Source: Peer-to-Peer Analytics by Callahan Associates.
*For 5,931 credit unions
With market uncertainty and murmurings about possible Fed rate hikes, credit unions kept their focus on short-term investments during 3Q 2016.

How Do You Compare?
Want to know where your credit union ranks in terms of investments against local and national peers of a similar size? Contact Callahan to find out.