Callahan & Associates now offers a delinquency and net charge-off packet in Peer-to-Peer that allows credit unions to delve into product-level delinquency and net charge-off rates. Benchmarking the asset quality of an institution has never been more precise or easier.
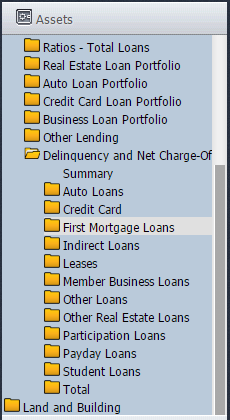
Product types range from first mortgages to indirect loans, member business loans to much more. Find these new displays saved in the Loans folder within the Assets tab of Peer-to-Peer.

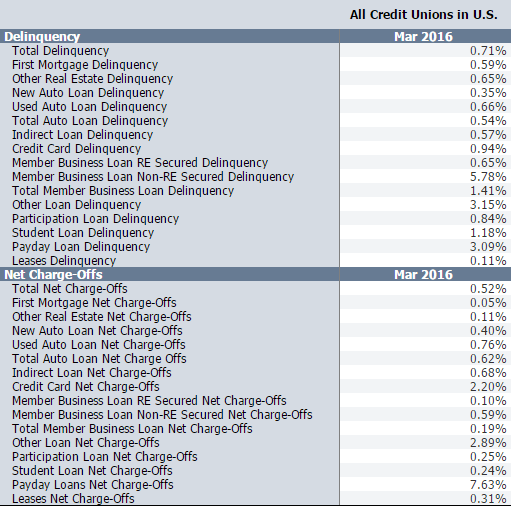
These categories are all available in the new Peer-to-Peer displays.

A comprehensive table of all delinquency and net charge-off ratios is readily available in the display packet. Benchmark any credit union against its peers to better understand the overall asset quality of the institution’s loan portfolio.

Save Time. Improve Performance.
NCUA and FDIC data is right at your fingertips. Build displays, filter data, track performance, and more with Callahan’s Peer-to-Peer analytics.
Request A Demo

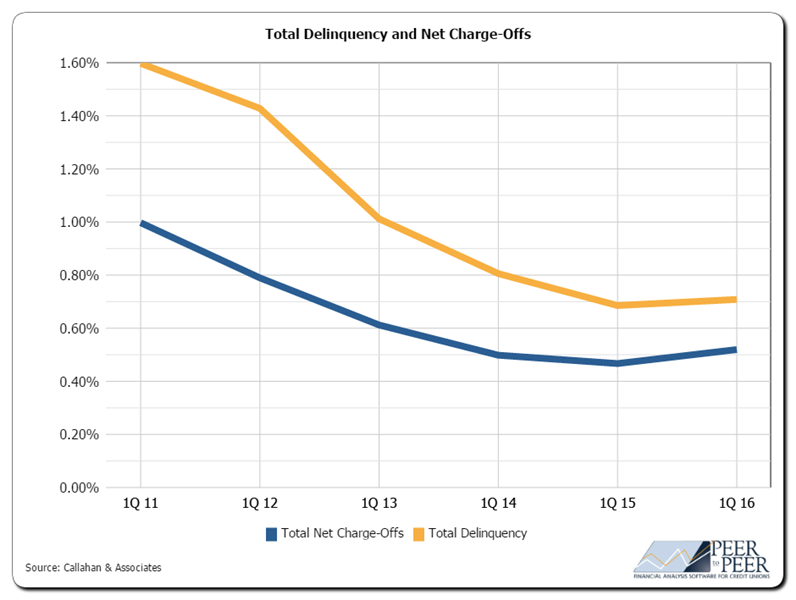
As of March 2016, total delinquency and net charge-offs were up slightly over March 2015. See if your institution outperformed the industry average.

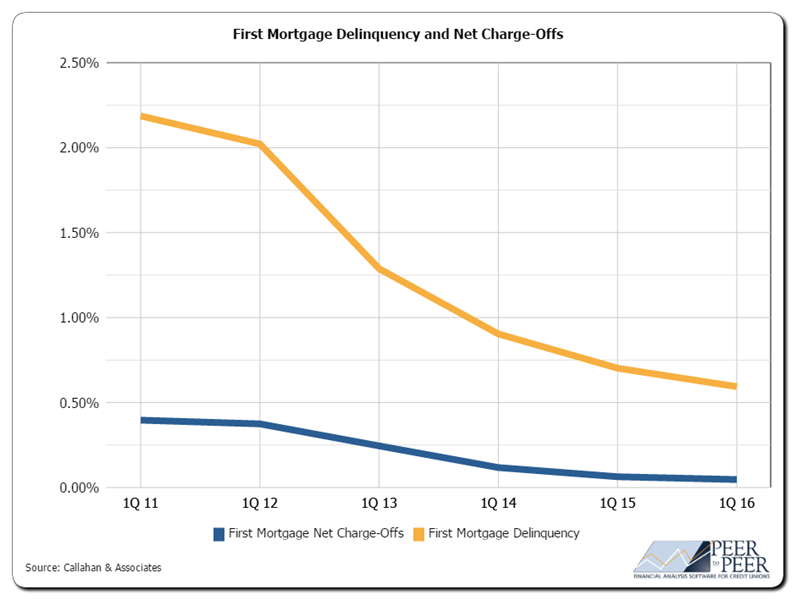
First mortgage delinquency and net charge-offs have been trending downward since peaking at 2.56% in December 2010. Check out the display in Peer-to-Peer to see how your portfolio compares to peers.