More than 600 credit unions have converted core processors in the past five years. The changing space of financial services makes selecting a technology partner more important than ever, and Callahan & Associates can help in that decision-making.
Callahan’s Supplier Market Share Guide: Credit Union Core Processors is the industry’s go-to resource for leaders starting the core conversion journey. Leaders who simply want a deeper understanding of the marketplace and trends find the guide helpful, too.
Although the major players continue to dominate the credit union core processing market, there are many ways each with their own meaning and relevancy in the eye of the beholder to slice that market pie. Callahan updates this guide every year in an ongoing effort to help credit union leaders make informed decisions about core systems and the IT investments that precede, accompany, and follow that core deployment.
Denominating The Dominators
There are two primary ways to look at market share: number of clients and assets under management. Through either lens, Fiserv and Symitar dominate.
Fiserv claims 31.5% of the credit union market with 1,709 of 5,425 U.S. credit unions running on one of the Wisconsin-based tech giant’s 16 platforms. Meanwhile, there are 625 credit unions 11.5% of the industry total on the Symitar platforms from Missouri-based Jack Henry & Associates. Of those, 498 are on Episys and 127 are on the CruiseNet solution for smaller institutions.
In dollar terms, Fiserv credit unions had a total of $561.0 billion in assets as of the second quarter of 2019; Symitar came in second at $493.3 billion. That’s out of total industry assets of approximately $1.2 trillion. FIS was a distant third at $194.0 billion, and no other provider had more than $60 billion.
Fiserv’s market share by client count fell 22 basis points year-over-year, to 31.5%. In fact, its client roster has steadily dropped in the past few years (as has the total number of credit unions in the movement). It counted 1,950 credit union core processing clients in the second quarter of 2016; 1,860 in 2017; 1,775 in2018; and 1,709 as of the second quarter of 2019.
According to consultants that help credit unions decide between competing cores, industry attention has shifted primarily to Fiserv’s DNA platform, a favorite among large credit unions. Those larger institutions are also partial to Episys and, increasingly, to the Corelation KeyStone platform.
There were 311 U.S. credit unions that reported more than $1 billion in assets in the second quarter of 2019. Of that group, 143 were running on Episys. The average Episys client had $793.8 million in assets. DNA reported 67 credit union clients with more than $1 billion in assets, and its average client had $1.5 billion in assets. Although Corelation had notably fewer billion-dollar clients seven as of the second quarter it has steadily grown this base since its launch in 2009, and its average client had $539.2 million in assets as of June 30, 2019.
TOP 10 CORE PROVIDERS IN RETURN ON ASSETS*
FINANCIAL DATA FOR U.S. CREDIT UNIONS | DATA AS OF 12.31.18
Callahan & Associates | CreditUnions.com
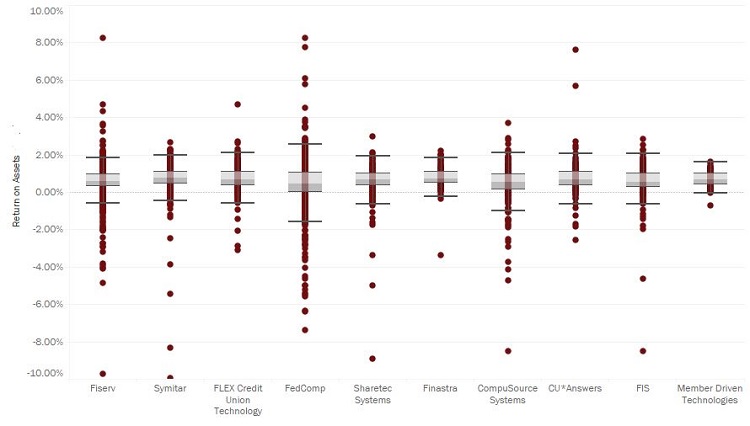
*Average annual ROI as listed in the profile financials section.
Small But Mighty Important
Although growing in popularity among the larger set, Corelation still serves a base of small credit unions. In fact, it added 17 credit union clients and gained 35 basis points in market share this past year. The average asset size of these new clients is $950.6 million.
Small credit union core processing pioneer FedComp continues to have the most credit unions on a single platform: 558 on its Platinum core. FedComp clients have slightly less than $2.9 billion in total assets, averaging $5.2 million each.
But FedComp is not alone in serving smaller credit unions. Fiserv serves hundreds on the legacy cores it still supports, and there are more than 30 suppliers offering more than 50 platforms in the industry today, from traditional closed systems to leadingedge, cloud-based solutions. The CU*BASE platform, meanwhile, added nine new clients in the past year. That core is from CU*Answers in Grand Rapids, MI, and also is distributed through two other CUSOs: CU*SOUTH in Fairhope, AL, and CU*NorthWest in Liberty Lake, WA.
Despite the difference in clientele size, all credit union suppliers share a common trait: They are trying to stay competitive in a shrinking population of credit unions.
Credit Union Performance
Continuing a decades-long trend, the number of credit unions in the United States dropped from 5,596 as of June 30, 2018 to 5,425 in 2019. Of note, shares were up 6.0% year-over-year to $1.2 trillion, loans were up 6.5% to nearly $1.1 trillion, and membership was up 3.7% to 119.7 million as the movement continues to grow despite having fewer institutions to serve America’s consumers.
Another sign of health: The average return-on-assets for the credit union industry was 0.97% in the second quarter of 2019. That’s up 2 basis points from 0.95% in the first quarter and 7 basis points from 0.90% in the second quarter of 2018.
The accompanying chart identifies the top 10 core providers according to average ROA of their clients. It shows the aggregate average and distribution among credit unions with that specific company’s core platform or platforms.
This is just one metric we hope you’ll find useful as you study the core processing marketplace. The other charts, insight, and analysis available from cover to cover in this annual guide provide a comprehensive view of the space and empower leaders to make smart decisions that will payoff for years to come. Enjoy.
The 2020 Core Report
Callahan’s Supplier Market Share Guide: Credit Union Core Processors helps leaders fully understand the performance and strengths of core processors in the credit union space. This guide offers:
- Expert opinion and advice.
- Changes in market share.
- Client performance comparisons.
- Aggregate assets for credit union clients.
- Newly acquired clients and integration information for select platforms.
If you already have a subscription, click here to access the guide or learn how to get access to this report by exploring our subscription options.
Explore
Subscription Options