Following COVID-induced shutdowns in the spring, the economy reopened at an uneven pace this summer, leaving different segments of the economy in varying stages of operation. Facing such uncertain conditions, members remained hesitant to resume spending at pre-COVID levels, and deposit growth continued to outpace historical rates.
In total, share balances rose 2.4% quarter-over-quarter and 18.1% year-over-year. Keeping with recent trends, core deposits which include checking, savings, and money market accounts accounted for 113.4% of the inflow. A contraction in certificate accounts marking the second consecutive quarter of certificate run-offcontributed to core deposit growth topping 100%. It was only nine months ago that certificate accounts peaked at $297.5 billion, but credit unions today face starkly different liquidity challenges than they did in March.
First mortgage gains accounted for 73.9% of balance sheet growth, continuing a trend from prior quarters. Balances there increased 2.6% quarter-over-quarter; however, that is slower than the 3.5% credit unions reported from the first to second quarters of this year. Elsewhere in lending, vehicle lending ticked up 1.7% quarter-over-quarter for the fourth consecutive quarter. This helped push total credit union loan balances 1.6% higher on the quarter and 6.2% higher than one year ago.
Find out how your credit union’s investment portfolio stacks up. If you would like to compare your own institution against the industry or a specific peer group, contact Callahan at (800) 237-5678 or TCUgroup@callahan.com.
Overall, however, loan portfolio growth was understated for the quarter as credit unions reduced interest rate risk and took advantage of historically wide margins on mortgage sales. First mortgages sold to the secondary market accounted for 41.2% of year-to-date originations as of the end of the third quarter. This is the highest level since the third quarter of 2016.
Given the excess liquidity at credit unions nationwide, investment balances for the industry rose 3.4% more than $18.1 billion from June 30 to total $551.9 billion as of Sept. 30. Within the portfolio, credit unions moved excess cash into traditional investments to mitigate rising earnings pressures following Fed rate cuts in March. Cash balances fell 2.5% from June; investments in securities and certificates expanded 7.4%.
TOTAL INVESTMENTS AND QUARTERLY GROWTH
FOR U.S. CREDIT UNIONS | DATA AS OF 09.30.20
Callahan & Associates | CreditUnions.com
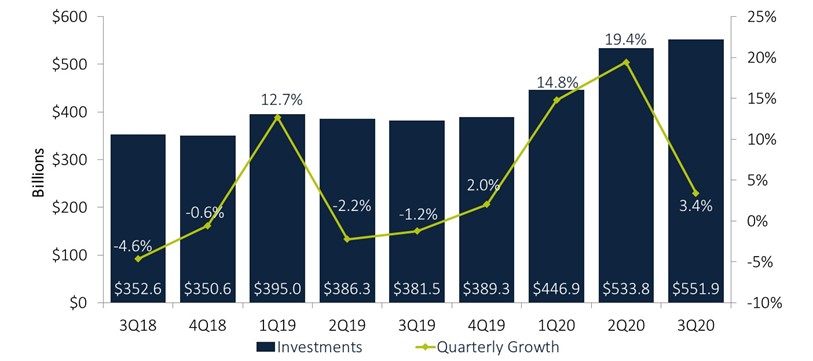
Investment balances climbed 3.4% from the second quarter of 2020.
Investment Composition
Cash and investment balances increased $18.1 billion in the third quarter to $551.9 billion as of Sept. 30. Of the $186.2 billion that credit unions held in cash balances at financial institutions, $134.6 billion was at the Fed and $39.0 billion was at corporate credit unions. That’s up 0.2% and down 6.0%, respectively, since June 30.
Cash at other financial institutions, primarily Federal Home Loan Banks, fell 10.4% across the quarter and accounted for $12.5 billion, or 6.7%, of overnight cash balances. In an effort to stabilize investment yields and in contrast to the first and second quarters of 2020 credit unions have actively placed non-loaned funds into traditional investments. Low rates have translated to shrinking portfolio earnings since March, when the interest rate on excess reserves fell from 1.60% to 0.10% in a matter of days and cut by a factor of 16 the yield of roughly one-third of the industry’s investment portfolio. Despite the efforts of credit unions, cash as a percentage of total investments in the third quarter accounted for 38.3% of total balances, the second-highest level on record. The highest level, 40.6%, was set in the second quarter of this year.
Beyond cash, nearly every other segment of the investment portfolio expanded on a linked quarter basis. Credit unions reported the largest gain in Federal agency debt, with MBS investments expanding 10.0% or, $14.4 billion and non-MBS securities growing 11.5% or, $5.8 billion. Credit unions posted the third-largest percentage increase in mutual fund investments. Those grew 7.5% as a result of portfolio valuations moving higher in the summer months and a growing appetite for yield among credit unions.
INVESTMENT PORTFOLIO COMPOSITION
FOR U.S. CREDIT UNIONS | DATA AS OF 09.30.20
Callahan & Associates | CreditUnions.com
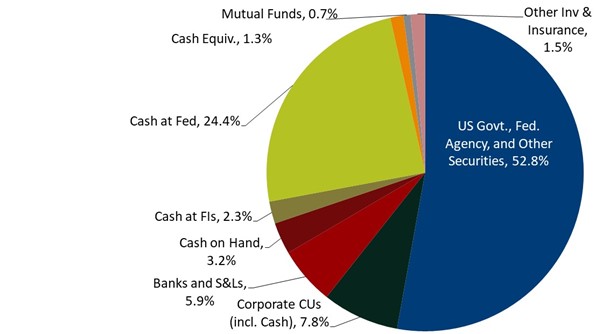
Agency allocations increased as low rates weighed on earnings.
Durations Lengthen
Portfolios shifted away from cash in the third quarter of 2020; consequently, maturities of investment portfolios at U.S. credit unions lengthened.
In a departure from the first two quarters of the year, every segment except for cash expanded from the second quarter. Cash and cash equivalents declined 2.5% on a quarterly basis falling from $216.8 billion as of June 30, 2020, to $211.4 billion as of Sept. 30 largely due to declines in corporate and other financial institution cash balances. As a result, this segment’s share of the portfolio fell 2.3 percentage points.
Credit unions reported the largest balance growth in investments maturing in one to three years. That segment rose $8.0 billion, or 7.4%, from midyear. From a percentage growth perspective, credit unions posted the largest increase in investments maturing in five to 10 years. That segment was up 20.2% as of June 30 with balances increasing $7.6 billion quarter-over-quarter and its share of the portfolio rising 1.1 percentage points.
INVESTMENT PORTFOLIO MATURITY
FOR U.S. CREDIT UNIONS | DATA AS OF 09.30.20
Callahan & Associates | CreditUnions.com

Credit unions targeted longer investments, and cash balances dropped 2.5% quarter-over-quarter.
Average Yield Declines
The average yield on investments fell 8 basis points quarter-over-quarter to 1.45% as of Sept. 30. The last time it was this low was in the first quarter of 2017, when the average yield was 1.44%.
With the effective rate floor at the zero bound and interest on excess reserves sitting at 0.10%, credit union investment earnings continued to decline. Although credit unions reported modest growth in non-cash investments, the earnings gains were not enough to offset the marginal returns from the nearly 40% industry cash allocation, which pushed yields lower.
Following COVID-induced shutdowns in the spring, the economy reopened at an uneven pace this summer, leaving different segments of the economy in varying stages of operation. Facing such uncertain conditions, members remained hesitant to resume spending at pre-COVID levels, and deposit growth continued to outpace historical rates.
In total, share balances rose 2.4% quarter-over-quarter and 18.1% year-over-year. Keeping with recent trends, core deposits which include checking, savings, and money market accounts accounted for 113.4% of the inflow. A contraction in certificate accounts marking the second consecutive quarter of certificate run-off contributed to core deposit growth topping 100%. It was only nine months ago that certificate accounts peaked at $297.5 billion, but credit unions today face starkly different liquidity challenges than they did in March.
First mortgage gains accounted for 73.9% of balance sheet growth, continuing a trend from prior quarters. Balances there increased 2.6% quarter-over-quarter; however, that is slower than the 3.5% credit unions reported from the first to second quarters of this year. Elsewhere in lending, vehicle lending ticked up 1.7% quarter-over-quarter for the fourth consecutive quarter. This helped push total credit union loan balances 1.6% higher on the quarter and 6.2% higher than one year ago.
Find out how your credit union’s investment portfolio stacks up. If you would like to compare your own institution against the industry or a specific peer group, contact Callahan at (800) 237-5678 or TCUgroup@callahan.com.
Overall, however, loan portfolio growth was understated for the quarter as credit unions reduced interest rate risk and took advantage of historically wide margins on mortgage sales. First mortgages sold to the secondary market accounted for 41.2% of year-to-date originations as of the end of the third quarter. This is the highest level since the third quarter of 2016.
Given the excess liquidity at credit unions nationwide, investment balances for the industry rose 3.4% more than $18.1 billion from June 30 to total $551.9 billion as of Sept. 30. Within the portfolio, credit unions moved excess cash into traditional investments to mitigate rising earnings pressures following Fed rate cuts in March. Cash balances fell 2.5% from June; investments in securities and certificates expanded 7.4%.
TOTAL INVESTMENTS AND QUARTERLY GROWTH
FOR U.S. CREDIT UNIONS | DATA AS OF 09.30.20
Callahan & Associates | CreditUnions.com
Investment balances climbed 3.4% from the second quarter of 2020.
Investment Composition
Cash and investment balances increased $18.1 billion in the third quarter to $551.9 billion as of Sept. 30. Of the $186.2 billion that credit unions held in cash balances at financial institutions, $134.6 billion was at the Fed and $39.0 billion was at corporate credit unions. That’s up 0.2% and down 6.0%, respectively, since June 30.
Cash at other financial institutions, primarily Federal Home Loan Banks, fell 10.4% across the quarter and accounted for $12.5 billion, or 6.7%, of overnight cash balances. In an effort to stabilize investment yields and in contrast to the first and second quarters of 2020 credit unions have actively placed non-loaned funds into traditional investments. Low rates have translated to shrinking portfolio earnings since March, when the interest rate on excess reserves fell from 1.60% to 0.10% in a matter of days and cut by a factor of 16 the yield of roughly one-third of the industry’s investment portfolio. Despite the efforts of credit unions, cash as a percentage of total investments in the third quarter accounted for 38.3% of total balances, the second-highest level on record. The highest level, 40.6%, was set in the second quarter of this year.
Beyond cash, nearly every other segment of the investment portfolio expanded on a linked quarter basis. Credit unions reported the largest gain in Federal agency debt, with MBS investments expanding 10.0% or, $14.4 billion and non-MBS securities growing 11.5% or, $5.8 billion. Credit unions posted the third-largest percentage increase in mutual fund investments. Those grew 7.5% as a result of portfolio valuations moving higher in the summer months and a growing appetite for yield among credit unions.
INVESTMENT PORTFOLIO COMPOSITION
FOR U.S. CREDIT UNIONS | DATA AS OF 09.30.20
Callahan & Associates | CreditUnions.com
Agency allocations increased as low rates weighed on earnings.
Durations Lengthen
Portfolios shifted away from cash in the third quarter of 2020; consequently, maturities of investment portfolios at U.S. credit unions lengthened.
In a departure from the first two quarters of the year, every segment except for cash expanded from the second quarter. Cash and cash equivalents declined 2.5% on a quarterly basis falling from $216.8 billion as of June 30, 2020, to $211.4 billion as of Sept. 30 largely due to declines in corporate and other financial institution cash balances. As a result, this segment’s share of the portfolio fell 2.3 percentage points.
Credit unions reported the largest balance growth in investments maturing in one to three years. That segment rose $8.0 billion, or 7.4%, from midyear. From a percentage growth perspective, credit unions posted the largest increase in investments maturing in five to 10 years. That segment was up 20.2% as of June 30 with balances increasing $7.6 billion quarter-over-quarter and its share of the portfolio rising 1.1 percentage points.
INVESTMENT PORTFOLIO MATURITY
FOR U.S. CREDIT UNIONS | DATA AS OF 09.30.20
Callahan & Associates | CreditUnions.com
Credit unions targeted longer investments, and cash balances dropped 2.5% quarter-over-quarter.
Average Yield Declines
The average yield on investments fell 8 basis points quarter-over-quarter to 1.45% as of Sept. 30. The last time it was this low was in the first quarter of 2017, when the average yield was 1.44%.
With the effective rate floor at the zero bound and interest on excess reserves sitting at 0.10%, credit union investment earnings continued to decline. Although credit unions reported modest growth in non-cash investments, the earnings gains were not enough to offset the marginal returns from the nearly 40% industry cash allocation, which pushed yields lower.
From a portfolio earnings perspective, investment income in the third quarter alone totaled $1.5 billion, down 18.8% from $1.8 billion in the second quarter. Lagging member loan demand and uncertainty surrounding the stickiness of deposits in the current economic environment continue to compound earnings pressures as credit unions seek to manage risk and capital targets.
YIELD ON INVESTMENTS
FOR U.S. CREDIT UNIONS | DATA AS OF 09.30.20
Callahan & Associates | CreditUnions.com
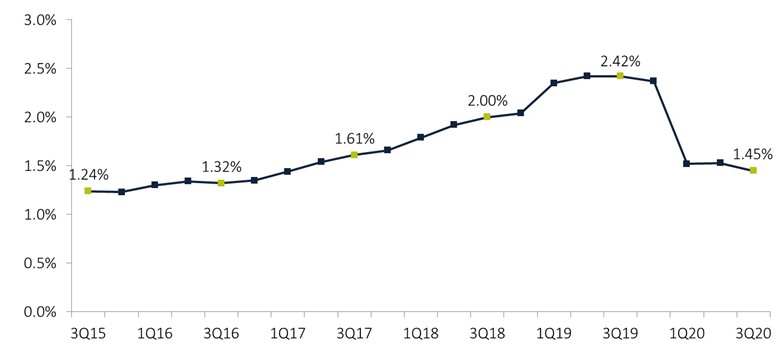
Yields fell 8 basis points despite growth in longer investments.
Weighted Average Life Increases
A shift in the portfolio composition pushed up the weighted average life of all credit union investments to 1.83 years as of Sept. 30. That’s up from 1.72 years last quarter. Specifically, an increase in intermediate and longer maturity segments one-to-three years was up 7.4% and five-to-10 years was up 20.2% combined with a 2.5% decline in cash and equivalents collectively lengthened the weighted average life of the industry investment portfolio.
INVESTMENT PORTFOLIO WEIGHTED AVERAGE LIFE
FOR U.S. CREDIT UNIONS | DATA AS OF 09.30.20
Callahan & Associates | CreditUnions.com

Shrinking cash allocations lengthened weighted average life.
More Institutions Participate In Derivatives
Notional balances increased $656.5 million quarter-over-quarter to $31.7 billion and finished the quarter up 124.4% annually following substantial growth in the first nine months of 2020. The 2.1% gain in the third quarter and balance of $31.7 billion marks an all-time high for the industry. Corresponding with the increase in derivative balances, the number of credit unions that reported derivative usage increased by five institutions, from 78 in the second quarter to 83 in the third quarter of 2020.
TOTAL NOTIONAL DERIVATIVES
FOR U.S. CREDIT UNIONS | DATA AS OF 09.30.20
Callahan & Associates | CreditUnions.com

Derivative program participation grew and balances increased 2.1% quarter-over-quarter.
Since the first and second quarters of 2020, significant uncertainty has clouded the consensus outlook for the industry and its members. A much-needed rebound, albeit modest, in the second half of the year was a welcome respite as major earnings and asset quality indicators improved. Looking ahead, credit unions will be challenged in the near term to mitigate earnings compression and motivated to pursue alternative non-interest income sources while keeping a close eye on the financial condition of their members and surrounding communities.
From a portfolio earnings perspective, investment income in the third quarter alone totaled $1.5 billion, down 18.8% from $1.8 billion in the second quarter. Lagging member loan demand and uncertainty surrounding the stickiness of deposits in the current economic environment continue to compound earnings pressures as credit unions seek to manage risk and capital targets.
YIELD ON INVESTMENTS
FOR U.S. CREDIT UNIONS | DATA AS OF 09.30.20
Callahan & Associates | CreditUnions.com
Yields fell 8 basis points despite growth in longer investments.
Weighted Average Life Increases
A shift in the portfolio composition pushed up the weighted average life of all credit union investments to 1.83 years as of Sept. 30. That’s up from 1.72 years last quarter. Specifically, an increase in intermediate and longer maturity segments one-to-three years was up 7.4% and five-to-10 years was up 20.2% combined with a 2.5% decline in cash and equivalents collectively lengthened the weighted average life of the industry investment portfolio.
INVESTMENT PORTFOLIO WEIGHTED AVERAGE LIFE
FOR U.S. CREDIT UNIONS | DATA AS OF 09.30.20
Callahan & Associates | CreditUnions.com

Shrinking cash allocations lengthened weighted average life.
More Institutions Participate In Derivatives
Notional balances increased $656.5 million quarter-over-quarter to $31.7 billion and finished the quarter up 124.4% annually following substantial growth in the first nine months of 2020. The 2.1% gain in the third quarter and balance of $31.7 billion marks an all-time high for the industry. Corresponding with the increase in derivative balances, the number of credit unions that reported derivative usage increased by five institutions, from 78 in the second quarter to 83 in the third quarter of 2020.
TOTAL NOTIONAL DERIVATIVES
FOR U.S. CREDIT UNIONS | DATA AS OF 09.30.20
Callahan & Associates | CreditUnions.com

Derivative program participation grew and balances increased 2.1% quarter-over-quarter.
Since the first and second quarters of 2020, significant uncertainty has clouded the consensus outlook for the industry and its members. A much-needed rebound, albeit modest, in the second half of the year was a welcome respite as major earnings and asset quality indicators improved. Looking ahead, credit unions will be challenged in the near term to mitigate earnings compression and motivated to pursue alternative non-interest income sources while keeping a close eye on the financial condition of their members and surrounding communities.