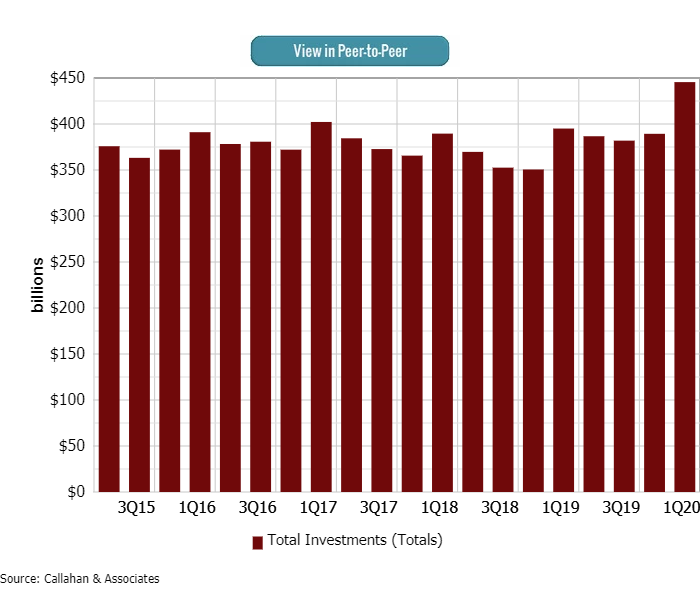
Credit unions held $441.9 billion in investments as of March 31, 2020. That’s up 13.5% from the fourth quarter of 2019, the largest quarterly increase on record, and up 11.9% from the year prior.
The rise in total investments is consistent with historical cyclicality. Typically, year-end bonuses and tax returns contribute to strong deposit inflows during the first quarter. What credit unions can’t lend, they invest.
The first three months of 2020 was similar to prior years; however, the economic uncertainty introduced by COVID-19 produced an additional uptick in share inflows as members moved their money into safer account options and the IRS delayed its April 15 tax filing deadline. Accordingly, share balances increased 3.0% from year-end and 6.7% from March 2019. In a departure from recent years, however, checking and savings products accounted for 80.9% of share growth in the past three months. The share of certificates, on the other hand, was down from a 30.9% share of inflows one year ago, whereas this year accounted for 9.9% of share growth since the fourth quarter.
This is the first of a two-part series on credit union investment trends in 2020. To view part two, click here.
Perhaps counterintuitively, the increase in shares drove a 3.3% quarterly increase and a 7.4% annual increase in total credit union assets as credit unions allocated to investments funds they did not lend. On an annual basis, loan portfolios expanded 5.1%; however, credit unions faced difficult lending conditions in the first quarter of 2020 and balances fell 0.5% from year-end. In the first three months of 2020, credit unions reported positive quarterly growth only in first mortgages. Every other segment contracted over the period as the impact of the global health crisis became acutely visible in falling consumer loan balances.
TOTAL INVESTMENTS
FOR U.S. CREDIT UNIONS | DATA AS OF 03.31.20
Callahan & Associates | CreditUnions.com
Credit union investment portfolios increased 13.5% from year-end, the largest quarterly increase on record.
Investment Composition: Cash Balances Surge Amid Economic Uncertainty
Cash and investment balances at U.S. credit unions grew $52.5 billion in the first quarter to $441.9 billion. This is largely the result of an influx of investments to overnight accounts at both the Federal Reserve and corporate credit unions. To a lesser extent, an influx of funds to federal agency MBS products played a role, too.
In total, credit unions reported $139.5 billion in cash balances at financial institutions, of which $100.0 billion was at the Fed and $29.3 billion was at corporate credit unions as of March 31. Cash at other financial institutions, primarily Federal Home Loan Banks, fell 5.0% during the quarter.
Make Trust A Part Of Your Portfolio
Interested in learning more about how the TCU Portfolios may provide greater efficiency, outside expertise, and performance as part of your credit union’s investment portfolio? Contact the TCU Group at tcugroup@callahan.com. To view the complete whitepaper, click the download button below.
First quarter deposit inflows coupled with slowing consumer loan demand has resulted in a record level of cash at credit unions. It is likely credit unions will allocate at least some of that cash to longer-maturing investments in the second quarter. Beyond cash, credit unions recorded the second- and third-largest quarterly percentage increases in federal agency MBS and corporate credit union investments 9.3% and 7.1%, respectively.
Despite a steady annual balance growth of 7.1%, mutual fund investments contracted during the quarter. This segment was down 3.2% thanks to the falling asset values related to March market volatility and related exits from positions.
INDIRECT INVESTMENT COMPOSITION
FOR U.S. CREDIT UNIONS | DATA AS OF 03.31.20
Callahan & Associates | CreditUnions.com
Cash at financial institutions and Agency MBS expand from year-end.
Yield On Investments: Fed Rate Cuts Contribute To A Decline In Investment Yield
When the Federal Reserve cut rates in March, it dropped the effective rate floor to zero. Interest on excess reserves (IOER) declined from 1.55% in December to 0.10% in March 2020.
Credit union investment earnings bore the brunt of these moves. The average yield on investments fell to 1.55% as of March 31, 2020. That’s 82 basis points lower than the fourth quarter of 2019 but is still in line with mid-year 2017 when the average yield was 1.54%.
The Fed has signaled it will use every tool in its arsenal to achieve its mandate of fostering a stable economy and support the U.S. economy as it navigates through the global health pandemic.
This helped normalize volatility in the fixed income markets in March. However, the combined effect of IOER moving to its lowest level post-financial crisis, credit unions holding record levels of cash, and a dramatic drop in yields across the curve collectively depressed investment yields throughout the industry.
Despite short-term investments and cash contributing the lion’s share of investment balance growth, credit unions are reporting dramatic shortfalls in earnings on their portfolios, notably cash positions. This is unlike what credit unions have experienced in recent periods. First quarter investment income fell 24.1% from the fourth quarter of 2019 to $1.5 billion. When paired with a $52.5 billion increase in balances, this resulted in a significant downturn in portfolio yield.
YIELD ON INVESTMENTS
FOR U.S. CREDIT UNIONS | DATA AS OF 03.31.20
Callahan & Associates | CreditUnions.com
Large cash positions and Fed rate cuts result in investment yield decline in 1Q20.
Sam Taft is the AVP of Analytics at Callahan & Associates. He also leads the business development efforts for the Trust for Credit Unions family of mutual funds, of which Callahan Financial Services (a broker dealer subsidiary of Callahan & Associates) is the distributor.


