The COVID-19 pandemic has reared its ugly head across many areas of the credit union business. Among the first areas impacted was non-interest income (NII), where credit unions noted a sudden, dramatic decline.
To help credit unions make well-informed strategic decisions about their bottom lines, Callahan & Associates has developed a tool for credit unions to upload their NII general ledger data into Peer-to-Peer and compare their performance against credit unions from across the industry.
On the quarterly 5300 Call Report, credit unions report two categories of non-interest income: fee income and other operating income. These two broad categories, however, are composed of many important subcategories on which the call report does not provide details. By uploading the more specific general ledger into Peer-to-Peer, credit unions can conduct a detailed analysis that includes historical as well as contemporary data broken into 22 separate categories, including NSF/overdraft fees, mortgage origination fees, ATM/debit card fees, wire fees, CUSO earnings, and interchange income, among others.
Fifty-nine credit unions with asset sizes ranging from $50 million to $15 billion had shared their data with Callahan & Associates as of July 15. As to be expected, NII streams vary by institution. In this sampling for 10 anonymized credit unions, non-interest income compositions differ drastically based on business model and strategy. Such differences have grown more dramatic as COVID-19 has set in and credit unions have turned to alternative income streams to supplement lost revenue elsewhere.
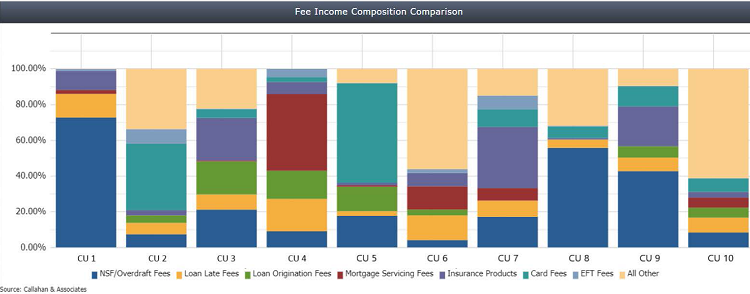
Note: This sample chart includes only fee income types, not other operating income streams such as interchange or CUSO income. Data for these revenue streams is available in Peer-to-Peer upon credit union participation.
Fee refunds are another hot topic in the COVID-19 climate. Although credit unions want to support their members many of whom might need relieve now more than ever fee waivers and refunds detract from income at a time when revenue is already suppressed. To frame a new refund strategy, it can be helpful to examine what peers are doing. When aggregated, the 59 credit unions participating in Callahan’s NII tool refunded more fees during the first three months of 2020 than they did through the first quarter of any prior year. March 2020 was the largest refund total for the month of March in any year on record.
Join the collaborative effort, and share your credit union’s NII data to start your own customized analysis using this new data set. For more information about how to use this tool in Callahan & Associates Peer-to-Peer, click here. Or, reach out to Callahan’s analyst team at analystsupport@callahan.com.