Top-Level Takeaways
-
A data-driven culture is emerging at Workers Credit Union as collaboration grows, silos shrink, and member intelligence becomes more actionable.
-
Workers is using the Tableau visualization software to help multiple departments share and interpret data.
Strategists across Workers Credit Union ($1.8B, Fitchburg, MA) are tapping into a trove of data to expand member service at the Northeastern cooperative.
CU QUICK FACTS
Workers Credit Union
Data as of 09.30.18
HQ: Fitchburg, MA
ASSETS: $1.8B
MEMBERS: 101,337
BRANCHES:15
12-MO SHARE GROWTH: 7.5%
12-MO LOAN GROWTH: 14.3%
ROA: 0.79%
Cassandra Stoddard, assistant vice president for enterprise analytics at Workers, says the credit union is relying heavily on easy-to-use data visualization tools to shape strategy and create a data-driven culture that serves members better and competes with traditional banks as well as fintech newcomers. Multiple departments take advantage of an enterprise license to Tableau, a data visualization software, to help them make decisions for their own areas of responsibilities and create new levels of collaboration with others.
Here Stoddard, who joined the credit union five years ago as a financial analyst, describes how the data culture at Workers is evolving and how its embracement of visualization tools has helped it take member service to the next level.
ContentMiddleAd
What opportunities do you see in member intelligence and analytics, and how will Workers leverage those opportunities?
Cassandra Stoddard: Member engagement will carry significant weight for our industry in the coming year, and analytics around that will have to be dynamic in every sense of the word. With the rapidly growing presence of fintechs, our member relationships are changing. The way we interact with our members has to evolve, too.

Cassandra Stoddard, AVP, Enterprise Analytics, Workers Credit Union
To find convenient ways to serve our members and increase interactions, Workers will rely heavily on data. First, we’re defining engagement, a project in and of itself. Once we develop metrics to gauge the kinds of interactions we deem significant, we’ll leverage our member data and collaborate with our marketing and member experience departments to drive these connections in a positive direction.
How does the credit union’s data analytics team work with the 300-plus employees at Workers?
CS: We have a small but effective enterprise analytics team at Workers. We’re slightly split between finance and IT. I have two business analysts one financial business analyst and one enterprise business analyst. We also rely heavily on our enterprise data architect, who reports up through IT.
We allocate requests based on the area of operation. Our financial business analyst serves our support department requests; our enterprise business analyst is generally focused on our retail team and branches. We’re careful not to be too rigid in these assignments, as requests often overlap or need the expertise of both analysts. We aim to tackle complex use cases as a team.
Manually tracking performance metrics can be time-consuming, but with Callahan Analytics it only takes a few minutes to see how you compare against peers. Stay ahead of the trends and learn how you can see Callahan Analytics in action.
What problems or opportunities are you addressing through data visualization?
CS: The idea behind bringing in data visualization software was to have a resource that would allow our end users to easily digest analytics and leverage the power of our data. Analytics can very easily be overwhelming or misconceived if not delivered properly. We wanted to make communication and consumption as easy as possible. We knew we had a long road ahead of us to develop a data-driven culture and step one was working on our delivery approach. That’s Tableau.
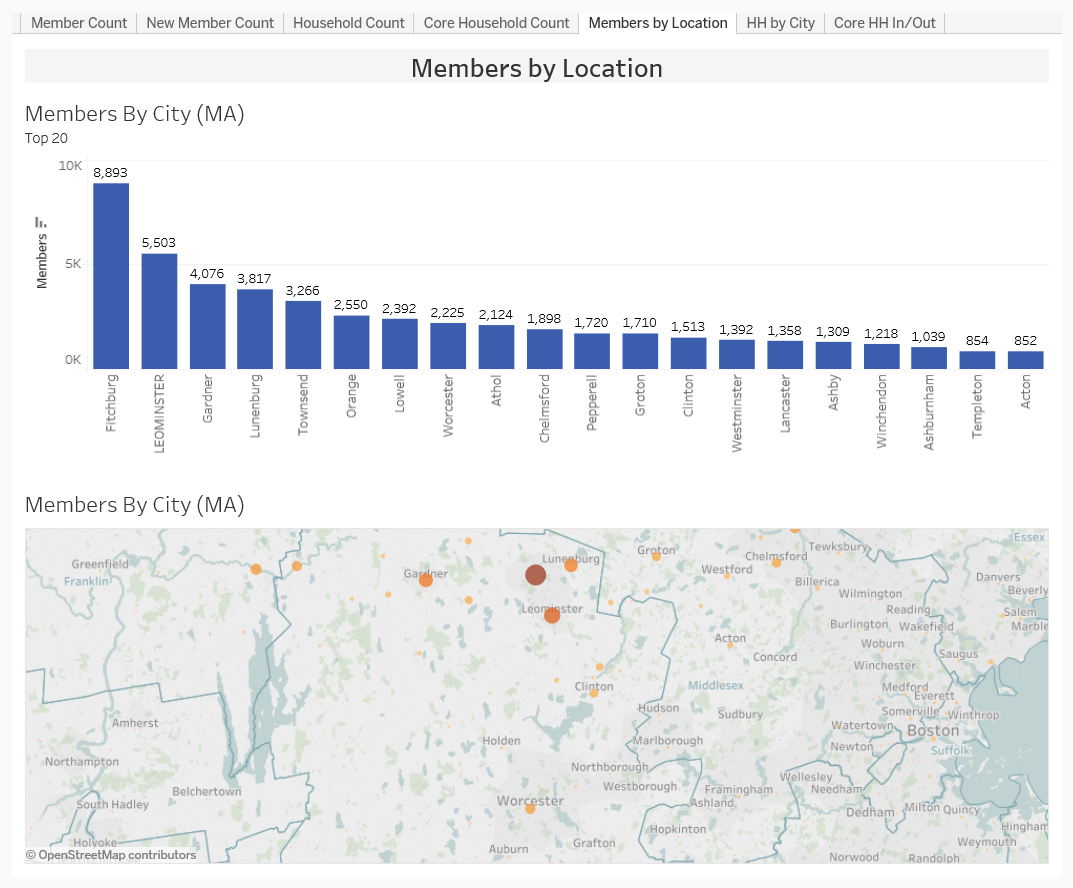
Workers created a Tableau map that uses member data to identify the areas where members are concentrated. The size of the dot on the map is proportionate to the number of members in that location.
![]()
Workers slices and dices transaction data by type, location, day, and total volume.
How did you identify those problems/opportunities?
CS: Experience. If you think about the nature of our role, we support those that want to communicate or validate a decision. These problems are just as much ours as they are theirs. Tableau is a resource to help our end users drive decision-making, effectively communicate viewpoints, and display results.
What role does Tableau play in your daily analytics work?
CS: Our team of analysts uses Tableau daily to clean data, answer questions, and deliver requests much faster than before. Aside from the advanced features that make analyzing data quick and efficient, we have begun to leverageTableau Server so we have a user-friendly, customizable site to direct our end users to.
Tableau is our resource for easily sharing interactive data across the organization. Its dynamic functionality and intuitive visualizations that enhance perception allows a variety of end users to explore common data sets and answer questions. We can now easily bring multiple data sets together so we can tell stories that apply to multiple business units. That increases communication at an organization level and reduces the need for overlapping data requests that were previously tailored to each end user. The security features also allow us to protect our data right down to the individual end user, which is an improvement to our data governance initiatives.
Check out the Credit Union Tableau Users Group. Connect with others from the credit union industry to work together on improving analytics that drive member value.
How have your end users reacted to your efforts, and how have you worked to win buy-in?
CS: I think we might have underestimated the demand for functional analytics. Not only are they engaged in what we’re providing, but they’ve also started to speak openly about objectives they hope to soon achieve by collaborating with my team and using Tableau. I think the hardest part was admitting that their demand exceeded our ability to supply.
Back to that security point. What enterprise risks did you take on in these endeavors and how do you mitigate that?
Safety First
The key to security and successful audits around data will revolve around documentation and transparency, says Cassandra Stoddard, analytics AVP at Workers Credit Union. The credit union is working on a process that addresses the following:
- How does Workers define each access group?
- Who belongs to what group and why?
- What can each group see and how can they interact with the data?
- Does the list of active end users balance back to HR employment status records on an ongoing basis?
CS: The disbursement of data and access security is risky business. The question is, what can they do with the data they are able to obtain, both internally and externally? Governance will be a hot topic for us in 2019. We were able to play it safe if 2018 with limited Tableau access and the disbursement of commonly accessible data.
As of today, very few of the views we have disbursed allow the end user to view data at the account level, and the ones that can are limited in terms of access. We also currently don’t allow our end users to export underlying data out of Tableau.
What value do you see in networking with the credit union TUG [Tableau users group], and what other networking do you recommend?
CS: Some can argue that one financial institution is like the next in terms of general functionality we all buy and sell money. However, the inner workings of a credit union are different from that of a bank. We play by different rules and abide by different regulations. Participating in TUG events specifically for credit unions allows us to spend less time trying to find ways to relate to one another’s analytics. Everything on the table is both relevant and relatable.
Something I personally love about credit unions is that we are collaborative by nature. The peers I have been lucky enough to connect with at these events don’t participate solely for personal gain. It’s about working together to advance the future of credit unions, so we can support the needs of our members for many years to come.
If I were to recommend another networking opportunity, it would probably be the AXFI Conference. They always gather speakers that jog your thinking in terms of process and perspective not just in today’s world but looking into the future of banking.
This email interview has been edited and condensed.
4 Tips To Takeoff With Tableau
Cassandra Stoddard, analytics AVP at Workers Credit Union, offers advice for making the most of the Tableau.
- Get to know Tableau. The eLearning center is packed with comprehensive, easy to follow lessons that cover a variety of topics you should know if you want to unlock its greatest potential.
- Take it easy. Roll out Tableau in waves and with care. If possible, make it personal. One-on-one introductions allow for customized Q&A which can increase adoption.
- Keep it simple. Give the gift of analysis, not paralysis.
- Use the power in numbers. Immerse yourself in the Tableau community.