Credit unions delivered exceptional value to members in first quarter 2018 across a host of metrics. Read on to see how macro-economic and credit union specific trends will influence the industry in 2018 and beyond.
Macro Economic Trends
Leading Economic Indicators, Rate Hike Effects, And Regulatory Updates
-
The expansion of the U.S. economy continued in the first quarter of 2018.
-
Unemployment has held steady at 4.1% for six consecutive months.
-
Economists predict a recession in late 2019 or early 2020.
Last year, the U.S. economy surpassed 103 months of expansion. That expansion continued into the first three months of 2018.
First quarter GDP was better than expected, 2.3% versus 2.0%. Core PCE (personal consumption expenditures) increased 1.9% annually, which was slightly under the 2% target rate. The ECI (employment cost index) rose at the highest rate during the current expansion period 2.7% year-over-year. The labor market is near full employment with nationwide unemployment holding steady at 4.1% from October 2017 through March 2018. It dropped to 3.9% and then 3.8% in April and May, respectively.
There are more than 6 million job openings, the highest in labor history, Steven Rick, chief economist with CUNA Mutual Group, told attendees gathered for the 2018 CUNA Finance Council meeting. That is going to push up wages and with it, inflation. We forecast it will trend down to 3.5% or so. [This is] one of the tightest labor markets since the 1920s.
ContentMiddleAd
Read the full analysis or skip to the section you want to read by clicking on the links below.
INDUSTRY AT-A-GLANCE BALANCE SHEET: ASSETS LENDING ASSET QUALITY INVESTMENTS BALANCE SHEET: LIABILITIES INCOME STATEMENT MARKET SHARE AND MEMBER IMPACT
The Tax Cuts and Jobs Act (TCJA) of 2017 remained in the spotlight during the first quarter of 2018 as businesses, investors, and governments assessed the expected near-and long-term effects of tax policy changes. Economists estimate the TCJA will add 0.2% to 0.4% to GDP growth over the next two years. Additionally, the International Monetary Fund cited the U.S. tax changes as a primary influence in its decision to revise upwards its 2018-2019 global growth expectations.
At the end of 2017, market expectations for rate hikes by the Federal Reserve in 2018 stood at three with zero probability of a fourth hike. The probability of a fourth hike increased to nearly 25% by the end of the first quarter
The Fed, now led by chair Jerome Powell, initiated the first hike in March. Basing its move on revised expectations for faster economic growth, higher inflation, and lower unemployment over the next several years, the Fed increased its benchmark federal funds rate by 25 basis points to a range of 1.50% to 1.75%. In June, it followed with another increase of 25 basis points to a range of 1.75% to 2.0%. As the fed funds rate ticks up, expect to see deposit and loan products reprice to adjust for the increase.
FEDERAL FUNDS RATE
DATA AS OF 06.30.19
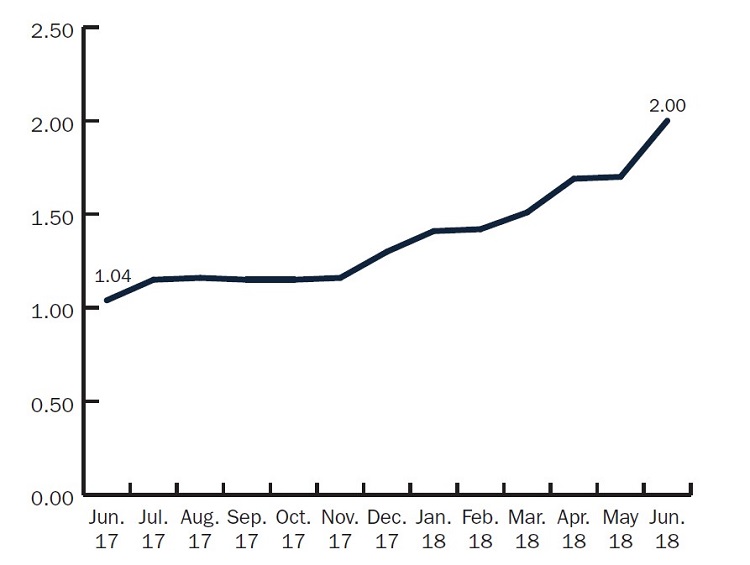
The Federal Reserve raised the target range for the federal funds rate by one-quarter of a percentage point to a range of between 1.75% to 2.0% during its June meeting.
According to Rick, When the Fed raises interest rates by a percentage point, credit unions typically raise CD rates by 70 basis points, MMA rates by 35 basis points, and savings rates by 10 basis points. That’s how the industry has priced over the past 30 years in three different rising rate environments.
Beyond rate hikes, there have been other notable events taking place in Washington. President Trump nominated Rodney Hood for a seat on the NCUA board, with a term expiring August 2023. Hood is a former member and vice chairman of the NCUA board and currently serves as a corporate responsibility manager for JPMorgan Chase.
Community development financial institutions (CDFIs) continue to be in the crosshairs of the Trump Administration. To reduce the federal deficit, the House passed a package of measures that rescinds $142 million from the CDFI Fund and Capital Magnet Fund. The package has moved to the Senate where its future is uncertain.
The Economic Growth, Regulatory Relief, and Consumer Protection Act (Senate bill S.2155) passed in May 2018 lowered the threshold for exemption from the Home Mortgage Disclosure Act (HMDA) submission requirements. Small volume originators less than 500 mortgages or 500 open-end lines of credit for each of the two preceding years are now exempt from the HMDA disclosures added by the Dodd-Frank Act.
In June, the Bureau of Consumer Financial Protection (BCFP, formerly known as the CFPB) announced the dismissal of more than 60 members of three disbanded advisory boards whose large sizes reportedly prevented members from being candid about their views. Later in the month, the White House nominated Kathy Kraninger, associate director of the Office of Management and Budget, to succeed BCFP acting directory Mick Mulvaney. Sen. Elizabeth Warren (D-MA) subsequently announced a nomination hold until Kraninger releases documents related to her role in the administration’s zero tolerance immigration policy.
Despite the BCFP shake-up and other industry moves by the administration, the outlook for 2018 is overwhelmingly positive; however, an economic contraction could be on the horizon.
Dr. Elliott Eisenberg, a nationally recognized economist, advised attendees of CU Direct’s Drive ’18 conference to enjoy the next 15 to 18 months of economic bliss. Consumer spending, corporate investment, and government spending will continue to produce robust numbers, Eisenberg says. But both Eisenberg and CUNA Mutual’s Rick say a recession is coming.
Rick says credit union executives should prepare for a technical recession in 2020. Eisenberg suggests credit unions think about how to position themselves when the economy gets dicier after sustained good times through late 2019 or early 2020. Eisenberg also stresses the recession he foresees will be milder than the last one and might last six to eight months.
Credit Union Trends
Industry At-A-Glance
Top-Level Takeaways
-
The NCUA’s equity distribution in March helped ROA reach 0.90%.
-
Strong loan growth pushed the industry loan-to-share ratio to 80.7%.
-
Credit unions have added 4.7 million net new members in the past 12 months.
The number of credit unions declined from 5,859 to 5,646 in the first quarter of 2018. As of March 31, there were 3,477 federally chartered credit unions and 2,169 state-chartered ones. The year-over-year decline of 213 credit unions is consistent with long-running consolidation trends. For example, the number of credit unions declined by 221 between the first quarters of 2016 and 2017.
Despite a drop in numbers, total assets increased $78.2 billion annually, or 5.8%, to end the first quarter at $1.4 trillion. Total loans at credit union increased $87.0 billion annually, or 9.7%, to $978.5 billion. Loan balances are positioned to surpass $1 trillion next quarter. The average outstanding loan balance as of the first quarter was $15,044. That’s up $534, or 3.7%, year-over-year.
On the liabilities side of the balance sheet, total credit union shares rose $64.9 billion annually to $1.2 trillion. That’s a 5.6% increase over the four quarters ending March 31, 2018. The average outstanding share balance was up $128, or 1.2%, year-over-year to $10,588.
INDUSTRY OVERVIEW
FOR U.S. CREDIT UNIONS | DATA AS OF 03.31.18
Callahan & Associates | www.creditunions.com
| Data As Of 03.31.18 | 12-Month Growth (1Q18) | 12-Month Growth (1Q17) | |
|---|---|---|---|
| Assets | $1.4T | 5.8% | 7.9% |
| Loans | $982.5B | 9.7% | 10.7% |
| Shares | $1.2T | 5.6% | 8.4% |
| Investments | $379.6B | -3.3% | 3.0% |
| Capital | $159.7B | 6.9% | 5.7% |
| Members | 114.1M | 4.3% | 4.2% |
Balance sheet growth for credit unions remains strong as 4.7 million net new members join the movement.
Balance sheet dynamics underpinned an annual increase in the loan-to-share ratio, which stood at 80.7% as of March 31, 2018. This is up from 77.7% in the first quarter of 2017 and down from 82.5% in the fourth quarter of 2017.
The industry net worth ratio in the first quarter was 10.9%, up two-tenths of a percent from one year ago. Net income expanded 34.5% annually to $12.7 billion as of March 31. The bulk of this growth came from other operating income, which jumped 27.9% year-over-year as the NCUA distributed equity related to the Corporate System Resolution Program. Credit unions reported that equity distribution as other operating income on the 5300 Call Report.
Also showing strength, ROA at credit unions nationwide reached 90 basis points as of first quarter 2018. That’s an annual increase of 19 basis points and is the industry’s highest ROA since Sept. 30, 2002. That high-water mark of 1.05% was primarily the result of NCUA insurance fund rebates hitting the income statement.
Finally, credit unions have added 4.7 million net new members over the past 12 months. The movement totaled 114.2 million members as of March 31, 2018, up 4.3% from one year ago. This marks six consecutive quarters of 4% annual membership growth.
Balance Sheet: Assets
-
Total loans at credit unions increased 9.7%; new auto grew 12.1%.
-
Loan origination balances increased $5.0 billion year-over-year.
-
Loan delinquency decreased to 66 basis points in the first quarter.
The credit union balance sheet sheet continued to improve during the first quarter of 2018. Strong lending, improving asset quality, and an evolving investment strategy all contributed to the industry’s performance in the first three months of the year.
Lending
Sustained strong lending across the industry underpinned an expansion of total assets in the first quarter. Loan originations increased $5.0 billion year-over-year, yet annual growth slowed to 4.4%. Total loans on the balance sheet grew 9.7% year-over-year. Prior to this quarter, loan growth had topped 10% annually for 14 consecutive quarters. Even this quarter, every segment of the loan portfolio increased compared to the first quarter of 2017.
First mortgages totaled $403.7 billion in the first quarter of 2018, and the 10.2% annual growth rate for these loans equaled that of the first quarter of last year. The loan segment within the first mortgage portfolio that increased the fastest was balloon/hybrid. Balances for these loans increased 15.4% to $112.8 billion. Fixed-rate first mortgages, the largest component of the portfolio, expanded 8.5% to $232.3 billion. Adjustable-rate first mortgages grew 7.2% annually to $58.6 billion.
12-MONTH LOAN GROWTH
FOR U.S. CREDIT UNIONS | DATA AS OF 03.31.18
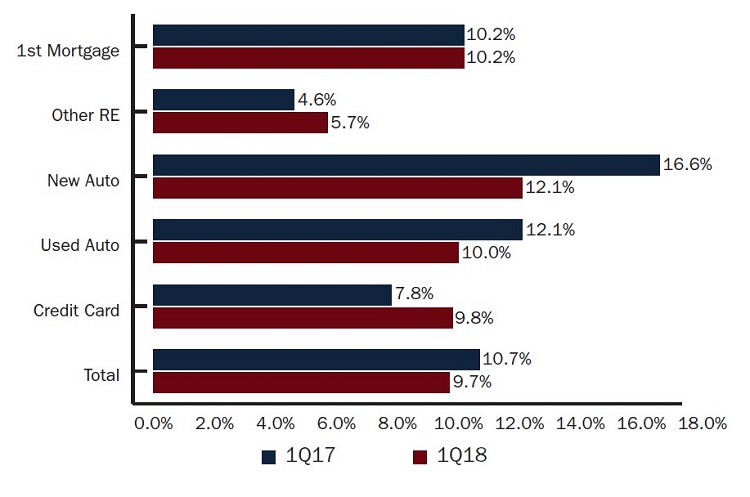
Revolving segment growth accelerates while first mortgages hold pace.
Source: Callahan & Associates.
Total auto loans increased $33.5 billion, or 10.8%, annually to reach $343.6 billion as of first quarter 2018. With annual growth of 12.1%, new auto loans increased $14.7 billion. Used auto loans increased 10.0% to reach $18.9 billion. Indirect loans continued to play a significant role in the auto loan portfolio. These loans expanded 16.6% year-over-year to close the quarter at $202.6 billion. They comprised 59.0% of total auto loans in the first quarter, up from 56.1% one year ago.
Credit card balances rose $5.1 billion, or 9.8%, annually to $57.2 billion. Other real estate loans increased 5.7% during the same period and reached $83.1 billion. These two products were the only major lending categories to grow faster this year than last.
Private student loans at credit unions increased $559.9 million, or 13.9%, to $4.6 billion. Commercial loans to members increased 2.8% quarterly to $57.0 billion as of first quarter 2018. Member business loans increased 4.7% quarterly and 14.8% annually to $71.7 billion.
Asset Quality
The delinquency rate at credit unions was 66 basis points in the first quarter of 2018. That’s down from 69 basis points one year ago. Although credit card delinquency was up 15 basis points to 124 basis points in the first quarter, credit unions reported a year-over-year improvement in every other loan category. Notable improvements include:
- Auto: Delinquency dropped 2 basis points to 55 basis points in the first quarter 2018.
- Commercial (to members): Delinquency decreased 10 basis points to 147 basis points in the first quarter.
LOAN-TO-SHARE RATIO
FOR U.S. CREDIT UNIONS | DATA AS OF 03.31.18
Callahan & Associates | www.creditunions.com
| Product | As Of 03.31.18 | Annual Change |
|---|---|---|
| 1st Mortgage | 0.43% | -0.01% |
| Other RE | 0.47% | -0.08 |
| Auto | 0.55% | -0.02 |
| Indirect | 0.57% | -0.03 |
| Credit Card | 1.24% | 0.15% |
| Member Commercial* | 1.47% | -0.10 |
| Total | 0.66% | -0.03 |
Although credit card delinquency is up 15 basis points, every other loan category has improved year-over-year.
*Quarterly due to reporting.
The net charge-off ratio for all credit unions was 60 basis points in the first quarter of 2018. That’s up from 58 basis points in the first quarter of 2017.
Investments
Total investments fell $12.8 billion, or -3.3%, annually to $379.6 billion. Quarterly, total investments were up $24.6 billion, or 6.9%. Credit unions primarily allocated that net increase in investments to cash at other financial institutions (Fed balances) and cash at corporate credit unions. The former rose from $66.2 billion in the fourth quarter of 2017 to $82.8 billion in the first quarter of 2018, increasing its share of the portfolio 3.2 percentage points. The latter expanded from $18.4 billion in the fourth quarter of 2017 to $24.8 billion in the first quarter of 2018, increasing its share of the portfolio 1.3 percentage points.
Balances for cash equivalents were up 18.1%. This segment represented the third-largest quarterly balance growth in the investment portfolio. Collectively, agency MBS and debt were the largest vehicle for non-cash investment. They accounted for 42.2% of the portfolio, down 2.9 percentage points from year-end 2017.
The average investment maturity for all U.S. credit unions shortened in the first quarter of 2018 as cash and equivalents collectively expanded 23.2% over the quarter. With 50.5% of the portfolio allocated to investments shorter than one year, institutions are well positioned to benefit from future rate increases.
Balance Sheet: Liabilities
-
Total shares at credit unions increased 5.6%.
-
Share drafts grew 9.4%; share certificates increased 6.6%.
-
95.8% of credit unions were well-capitalized as of March 31.
Strong loan demand is tightening liquidity across the industry. Credit unions typically use certificate specials to attract deposits and increase liquidity. As such, share certificates were the only deposit product in the portfolio that grew faster in 2018 than in 2017.
Total shares at credit unions have increased $64.9 billion in the past 12 months. Share drafts expanded 9.4% to $196.8 billion, leading the way in annual growth. Regular shares rose $26.4 billion, or 6.5%, to $437.5 billion as of first quarter. Money market balances grew 2.8% annually to $266.6 billion; share certificates increased $13.4 billion, or 6.6%, annually.
12-Month Share Growth
FOR U.S. CREDIT UNIONS | DATA AS OF 03.31.18
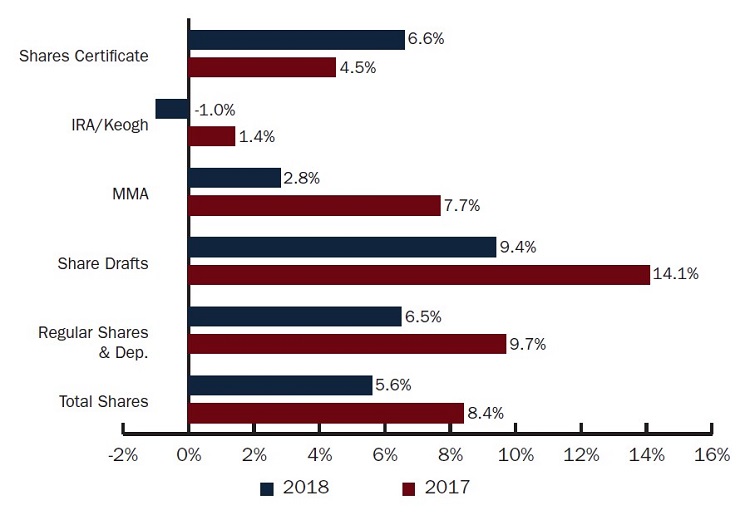
Growth in share certificates and share draft accounts accelerated in 2017 despite the overall deceleration in the industry’s share portfolio.
Source: Callahan & Associates.
Total share balances at credit unions grew 2.8 percentage points slower in the first quarter than one year ago. That’s not surprising as stock market movements and share growth trends generally have an inverse relationship. As the stock market rises, members tend to withdraw money from their financial institutions to participate in the stock market.
In a rising rate environment, credit unions reprice share products and the cost of funds tends to increase. Since the first quarter of 2017, the average cost of funds has increased 10 basis points to 0.68%. Expect this ratio to rise throughout 2018 as the Fed announces more rate hikes.
Net worth at credit unions increased $11.1 billion, or 7.7%, over the past year to $156.0 billion as of the first quarter. Net worth growth outpaced asset growth, which led to a 10.9% increase in the net worth ratio. In the first three months of the year, 95.8% of all credit unions in the nation were well-capitalized, meaning their net worth was higher than the NCUA’s 7% threshold.
Total credit union capital increased 6.9% year-overyear to $159.7 billion as net worth increased along with the allowance for loan and lease losses. Allowance for loan and lease losses expanded 13.2% annually to $9.1 billion in the first quarter. In the event of a downturn, the industry is well reserved. Its coverage ratio increased 10.55 percentage points annually and reached 141.1% as of March 31, 2018.
Income Statement
-
NCUA’s equity distribution contributed to a 27.9% increase in other operating income.
-
Total revenue increased 14.2%, the highest since 2007.
-
The net interest margin was up 14 basis points to 3.03%.
Growth in total revenue at credit unions broke double-digits for the first time since the end of 2007. Total revenue grew 14.2% annually to reach $17.7 billion in the first quarter. This is the highest growth recorded since the industry reported 14.5% growth in the first quarter of 2007.
Interest income rose $1.5 billion, or 13.1%, over the past year to $12.8 billion in the first quarter. Non-interest income increased $767.8 million, or 18.0%, to $5.0 billion. The increase in non-interest income partly reflected the recognition of the Share Insurance Fund equity distribution scheduled to be paid later this year.
TOTAL REVENUE AND ANNUAL GROWTH
FOR U.S. CREDIT UNIONS | DATA AS OF 03.31.18
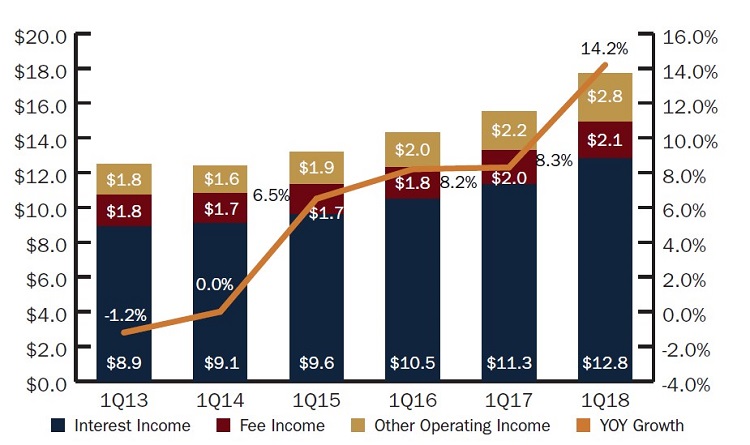
The NCUA’s equity distribution from the Share Insurance Fund underpins the 14.2% annual growth in credit union revenue.
Source: Callahan & Associates.
Interest expense rose 23.2% to $2.1 billion annualized in the first quarter of 2018. That’s up $399.1 million from 2017. Non-interest expenses grew $770.0 million, or 7.6%, over the past year to $10.9 billion in the first quarter. Labor expenses which were up $375.9 million, or 7.1% annually drove that increase in non-interest expense.
The industry’s net interest margin widened 14 basis points year-over-year to 3.03%; its operating expense ratio increased 4 basis points to 3.08%. The net interest margin increased faster than operating expenses, so the spread between the two ratios decreased to 5 basis points in the first quarter.
NET INTEREST MARGIN VS. OPERATING EXPENSE RATIO
FOR U.S. CREDIT UNIONS | DATA AS OF 03.31.18
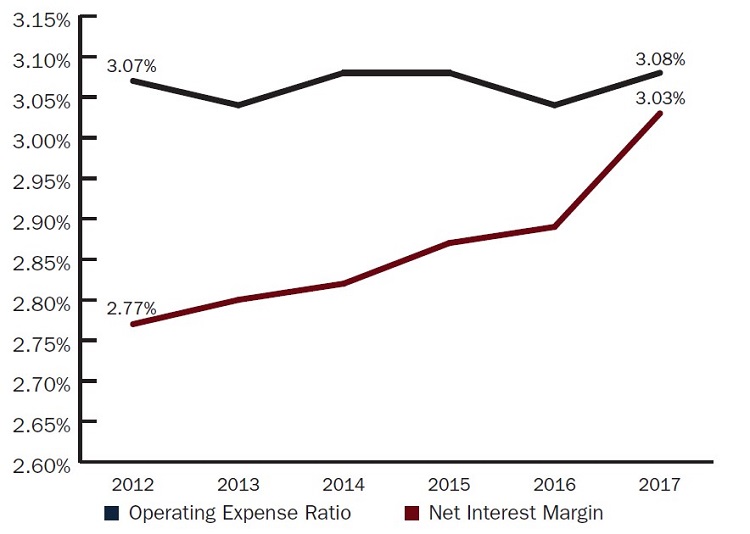
The earnings gap has narrowed to a slim 5 basis points, underscoring the need for additional sources of non-interest income.
Source: Callahan & Associates.
Market Share And Member Impact
-
Credit union market share increased across all products.
-
The average member relationship expanded to $18,581.
-
Product penetration deepened for share drafts, credit cards, and auto loans.
Although credit unions are performing well financially, it is paramount for the movement to keep the interest of its member-owners at the forefront of all decision-making. Members ultimately vote with their wallets, and they seem to be voting in favor of credit unions as the industry captures greater market share.
Credit unions are winning over customers from banks and other non-deposit financial institutions. The industry’s overall mortgage market share rose 30 basis points annually to 8.9%. Despite the fact first mortgage originations decreased -1.4% annually, the industry recorded its highest mortgage market share on record.
Credit union consumer loan originations grew 8.4% year-over- year as the industry incrementally captured greater auto finance market share. Credit unions have increased their share of the auto market by 5.9 percentage points since the first quarter of 2013 to 20.2% today.
Furthermore, non-revolving consumer loan balances predominantly auto, unsecured, and student loans at credit unions climbed to $375.5 billion as market share increased to 13.2%.
AVERAGE RETAIL MEMBER RELATIONSHIP
FOR U.S. CREDIT UNIONS | DATA AS OF 03.31.18
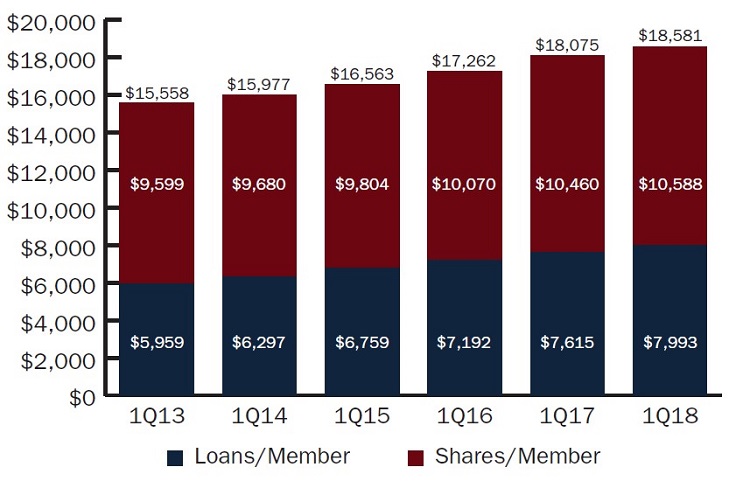
Loan and shares balances per member both are growing at credit unions nationally as members expand their average relationship.
Source: Callahan & Associates.
In the past 12 months, 4.7 million net new members have joined the credit union movement. The average retail member relationship, a measure of a member’s credit union relationship that excludes commercial loans, grew $506 annually, or 2.8%, to $18,581. Over a five-year period, the average retail member relationship has expanded $3,023.
Credit unions are not only recruiting new members to the movement, they’re also enticing members to use products. Member penetration rates have deepened along with membership growth. Share draft penetration has increased 4.8 percentage points since 2013 to 57.3% today. Auto penetration has grown 4.6 percentage points over the past five years to 20.6% as of first quarter 2018. Credit card penetration reached 17.3% in the first quarter, up from 15.3% in 2013, while real estate penetration has held steady at 4.4%.
CREDIT UNION MARKET SHARE
FOR U.S. CREDIT UNIONS | DATA AS OF 03.31.18
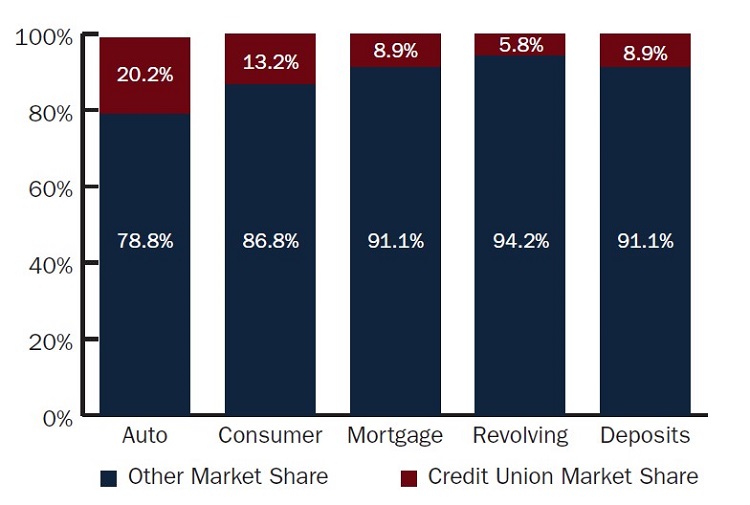
Credit unions are capturing more of the financial services market than ever; however, there is still a lot of opportunity to demonstrate the power of the movement.
Source: Callahan & Associates.
Credit unions are capturing greater market share across the board, but the percentage amounts are minor in the grand scheme of financial services. There is still tremendous opportunity for credit unions to help steer members through their life’s journeys and become a trusted partner along the way. Credit unions are off to a great start in 2018.
provision for loan and lease losses was up 8 basis points year-over-year to 0.48%. This has been on the rise for the past four years as credit unions reserve more in their allowance accounts to absorb possible credit losses and has reached its highest level since 2011. The industry’s ROA increased 1 basis point annually to 0.78% continuing it’s ascent.
This article appeared originally in Credit Union Strategy & Performance. Read more today.