Credit unions delivered exceptional value to members in second quarter 2018 across a host of metrics. Read on to learn the full story.
Macro Economic Trends
GDP Expands; So Does Consumer Debt
-
Real GDP increased at an annual rate of 3.5%, the highest third quarter rate since 2014.
-
The national unemployment rate is the lowest it has been, 3.7%, since year-end 1969.
-
The Federal Reserve has raised rates four times in 2018, and economists project it will raise rates two more times in 2019.
The U.S. economy has shown positive momentum throughout 2018. Gross domestic product growth is healthy, unemployment levels are at record lows, inflation is at the target rate, and wages are on the rise. However, confidence in the marketplace is pushing consumers to take on more debt.
As credit unions work to balance the opportunities and risks of the current economic expansion, here’s what they need to know about the broader financial market and national economic trends.
By most measures, the U.S. economy continued to expand in the third quarter of 2018, albeit at a slower pace than in the second quarter. The quarter ending Sept. 30 marked the 18th consecutive quarter of positive GDP growth. Real GDP increased at an annual rate of 3.5%, down slightly from 4.2% in the second quarter, to $18.7 trillion. This is the highest third quarter rate since 2014.
Personal consumption, which comprises the majority of GDP, grew in relative lockstep with total GDP over the year. Adjusted for inflation, consumer spending reached $13.0 trillion or 69.5% of the country’s GDP. Its annual growth of 3.1% accounted for 2.7 percentage points of real GDP growth as of Sept. 30, 2018.
Spending on goods rose at a rate of 4.4% versus 2.5% for services; however, U.S. consumers still spent fewer dollars on goods than on services. Similar to the second quarter of 2018, consumption of goods and services comprised 24.6% and 44.9%, respectively, of total GDP dollars.
Net exports, the difference between goods and services purchased from abroad and those sold abroad, decreased at the fastest pace of any GDP component. Although imports were down 11.7% over the quarter, they exceeded exports by $939.0 billion in real terms. The United States continued to buy a larger proportion of goods and services from other nations than it sold in the third quarter, contributing to a growing trade deficit. This dynamic deducted 5.0% from total GDP dollars and negatively impacted GDP growth by 1.8 percentage points.
Most economists expect GDP growth to slow in 2019 as the effects of tax cuts wane, says Jay Johnson, partner at Callahan & Associates, the Washington, DC-based credit union consulting firm.
Government spending, however, positively impacted GDP growth.
It has increased each of the past four consecutive quarters and was up 2.4% annually as of Sept. 30. Government spending contributed 17.2% to the country’s real GDP and 0.56% to the annual GDP rate. Business investment which increased 5.3% over the year and accounted for 2.0% of the annual real GDP rate contributed the remaining 18.3% of real GDP.
At $2.7 trillion, non-residential fixed investment made up the majority, 79.6%, of business investment in the third quarter. On the other side, private inventories expanded $76.3 billion over the second quarter of 2018 the largest increase in inventories since year-end 2015.
COMPONENTS OF TOTAL GDP GROWTH
DATA AS OF 09.30.18
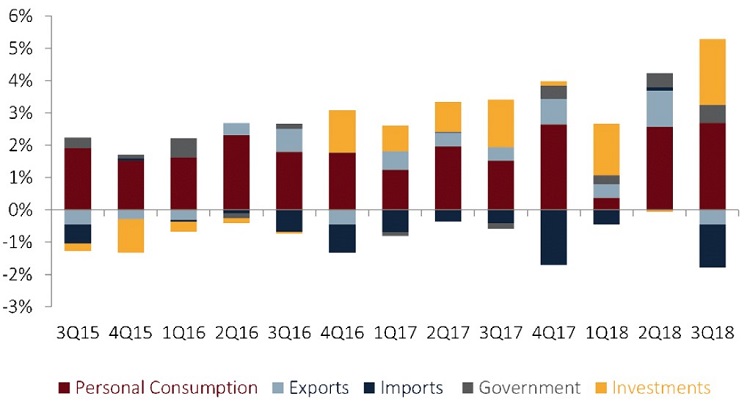
Total imports exceeded total exports, leading to a net export deficit and negatively impacting total GDP.
Source: Federal Reserve of St. Louis
The Federal Reserve’s preferred measure of inflation, the core personal consumption expenditures (core PCE) price index, rose 4 basis points over the second quarter to 2.0% as of Sept. 30. Core PCE excludes the more volatile food and energy prices, and economists consider it a more stable measure of inflation. It has risen for four consecutive quarters and, as of Sept. 30, 2018, was in line with the Fed’s 2.0% target inflation rate.
ContentMiddleAd
Read the full analysis or skip to the section you want to read by clicking on the links below.
INDUSTRY AT-A-GLANCE BALANCE SHEET: ASSETS LENDING ASSET QUALITY INVESTMENTS BALANCE SHEET: LIABILITIES SHARES INCOME STATEMENT
Wage growth, which has lagged behind inflation in preceding quarters, recorded its fastest growth since the second quarter of 2008. According to the Labor Department, wages and salaries paid to the private sector rose 3.1% from one year ago. Economists expect wage growth to accelerate as the labor market tightens.
At 3.7%, the unemployment rate in the third quarter of 2018 was the lowest it’s been since Dec. 31, 1969. In the past quarter, 247,000 people rejoined the labor force and the number of employed increased 600,000 to 156.0 million.
With inflation rising and low unemployment, the Federal Reserve expects to continue raising interest rates in 2019, Johnson says. At the December meeting, the Federal Open Market Committee’s consensus was two increases during the year.
The Fed has raised interest rates four times in 2018, and economists expect the Fed to move them twice more in 2019. With the current target federal funds rate of 2.25%- 2.50%, interest rates charged by financial institutions have climbed higher throughout the year for both deposits and loans. According to the Federal Reserve of St. Louis, the average rate for a 30-year fixed-rate mortgage was 4.57% as of Sept. 30, 2018. That’s up 3 basis points in the past quarter and 69 basis points in the past year.
However, rates are still relatively low compared to historical rates. For example, the average rate for a 30-year fixed-rate mortgage in the third quarter of 2007 was 6.55%. As such, economists with Freddie Mac expect this key rate to continue to rise through 2019 and into 2020.
According to the Federal Reserve Bank of New York, total debt in the economy reached a record high $13.5 trillion in the third quarter. Driven largely by $9.1 trillion in mortgage loans, total household debt was $837 billion higher than its previous high-water mark of $12.7 trillion in 2008.
On the back of strong faith in the markets and record low unemployment levels, consumers are more comfortable taking on debt and are doing so at levels higher than what was seen during the recession in 2008, Johnson says. The question is whether higher interest rates will slow consumer borrowing in 2019.
30-YEAR FIXED MORTGAGE RATES
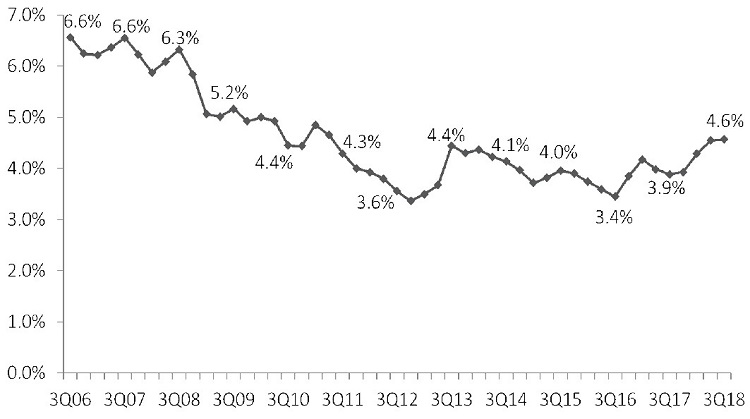
The rate for a 30-year fixed-rate mortgage was up 69 basis points year-overyear; however, as of Sept. 30, 2018, it remained well below pre-recession levels.
Source: Federal Reserve of St. Louis
According to the Federal Reserve of New York, housing debt nationally increased $141 billion in the third quarter. Total housing debt which comprises mortgages, home equity loans, and lines of credit was nearly $9.6 trillion. Consumer housing debt is nearing the $10 trillion peak hit in the second quarter of 2008, right before the Great Recession.
Economists with Freddie Mac say increasing rates and home prices will likely depress home-buying activity in the United States throughout 2018. And although rates are expected to continue to increase through 2020, Freddie Mac projects total home sales will regain momentum in 2019 and 2020.
Looking ahead, fourth quarter GDP and broader economic data will signal how consumers are participating in the economy.
Credit Union Trends
Industry At-A-Glance
Top-Level Takeaways
-
Membership growth increased 35 basis points year-over-year to 4.4%.
-
The average member relationship expanded 3.0% year-over-year.
-
Loan growth outpaced share growth for the 22nd consecutive quarter, and the loan-to-share ratio reached a record 84.8%.
The number of active credit unions continued to decline in the third quarter of 2018, dropping by 45 to 5,551 as of Sept. 30. The industry closed the quarter with 3,421 federal charters and 2,130 state charters. Since 2013, the credit union industry has lost 1,202 credit unions to mergers, liquidations, and purchase and acquisitions.
Despite a dip in institutions, annual membership growth was up 35 basis points year-over-year to 4.4% as of Sept 30. The 4.9 million new members who joined the movement in the past year have brought total membership to 116.8 million.
MEMBERSHIP AND ANNUAL GROWTH
FOR U.S. CREDIT UNIONS | DATA AS OF 09.30.18
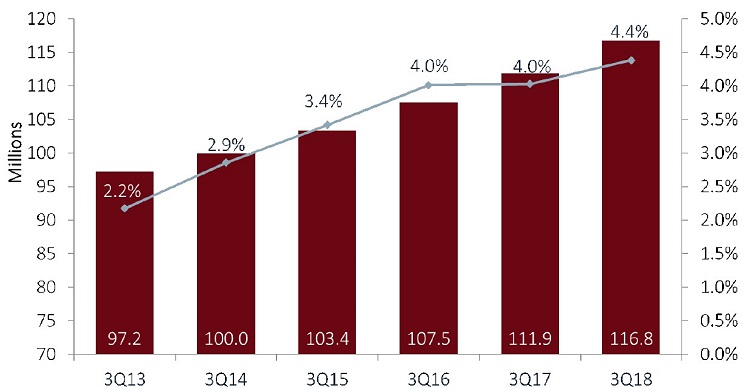
Credit union membership increased by 4.9 million in the past year, bringing total membership to 116.8 million as of Sept. 30, 2018.
Source: Callahan & Associates
The credit union movement is nearly 117 million members strong. More importantly, these are engaged members, not empty relationships. The average member relationship was up 3.0% year-over-year to $18,748 as of Sept. 30.
Notably, the average member relationship continues to increase at a time when membership growth is at record levels, says Jay Johnson, a partner at Callahan & Associates, the Washington, DC-based credit union consulting firm. This indicates credit unions are both expanding longer-term relationships and effectively onboarding new members.
AVERAGE MEMBER RELATIONSHIP
FOR U.S. CREDIT UNIONS | DATA AS OF 09.30.18
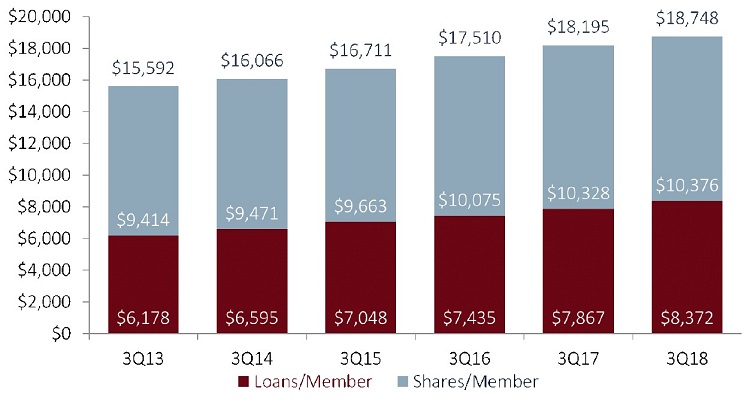
Both the average loan balance and the average share balance per member have gradually every year for the past five years. They were up, 6.4% and 0.5%, respectively, in the third quarter of 2018.
Source: Callahan & Associates
Along with stronger average member relationships, credit unions have reported improvements from five years ago in credit card, share draft, and auto penetration. A growing membership base runs the risk of diluting penetration metrics; however, that is not currently the case with U.S. credit unions.
Credit unions are clearly finding success deepening relationships while supplying a growing number of products to individual members, evidenced by steadily increasing penetration rates, says Sam Taft, associate vice president of analytics and business development.
Mirroring broader economic trends, growth on both sides of the credit union balance sheet slowed down in the third quarter. However, credit union assets did grow 5.6% year-over- year to nearly $1.5 trillion as of Sept. 30.
PRODUCT PENETRATION
FOR U.S. CREDIT UNIONS | DATA AS OF 09.30.18
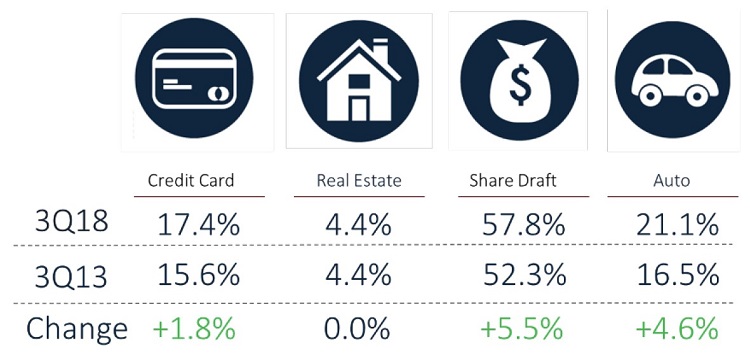
The number of members taking advantage of key products has increased alongside the average member relationship at credit unions.
Source: Callahan & Associates
The average loan balance per member excluding member business loans also increased. It was up 6.4% from $7,867 one year ago to $8,372 as of Sept. 30, 2018. Investment and cash balances declined 5.4% year-over-year as credit unions allowed investments to run-off to fund persistent loan demand.
The aggregate loan balance at credit unions nationwide surpassed $1.0 trillion in the third quarter. The 9.5% annual growth in balances, however, was 25 basis points slower than in the second quarter of 2018 and 103 basis points slower than in the third quarter of 2017.
Deposit growth also decelerated 1.7 percentage points year-over-year to 5.0% however, total share balances still surpassed $1.2 trillion in the third quarter. The average deposit balance per member increased 0.5% year-over-year to $10,376.
It is notable that loan growth has surpassed share growth for 22 consecutive quarters. As such, the loan-to-share ratio is on the rise and was up 3.5 percentage points in the past year to 84.8% in the third quarter. Credit unions have now surpassed the previous high of 83.1% at year-end 2008.
INDUSTRY OVERVIEW
FOR U.S. CREDIT UNIONS | DATA AS OF 09.30.18
Callahan & Associates | www.creditunions.com
| Data As Of 09.30.18 | 12-Month Growth (3Q18) | 12-Month Growth (3Q17) | |
|---|---|---|---|
| Assets | $1.5T | 5.6% | 6.7% |
| Loans | $1.0B | 9.5% | 10.5% |
| Shares | $1.2T | 5.0% | 6.7% |
| Investments | $352.6B | -5.4% | -2.2% |
| Capital | $166.2B | 6.4% | 6.4% |
| Members | 116.8M | 4.4% | 4.0% |
Growth slowed on both sides of the credit union balance sheet in the third quarter. Investments and cash balances continued to roll off as credit unions look for liquidity to fund loans.
Balance Sheet: Assets
-
Growth in consumer loan originations accounted for the lion’s share of total loan origination growth.
-
Credit union market share in major loan products has increased in the past five years.
-
Asset quality improved across the credit union loan portfolio.
The credit union balance sheet is adjusting with the economy. Interest rate increases have impacted assets as well as liabilities; however, consumer confidence in the broader economy has translated to loan balances increasing at a faster pace than deposits. Nevertheless, asset quality among key metrics has improved.
Loans
Annual loan growth was down 103 basis points from the third quarter of 2017 to 9.5% in the third quarter of 2018. However, a still-robust loan demand pushed total loans past $1.0 trillion.
Total loan originations have expanded year-over-year in every third quarter for the past four years. In the third quarter of 2018, they increased 6.5% annually 4 basis points faster than one year ago to $389.9 billion year-to-date. Consumer loan originations were up 8.5%, or $19.9 billion, from one year ago and reached $252.4 billion through the first nine months of 2018. They accounted for 64.9% of total loan originations and 83.2% of the year-to- date growth in total loan originations.
YTD LOAN ORIGINATIONS AND ANNUAL GROWTH
FOR U.S. CREDIT UNIONS | DATA AS OF 09.30.18
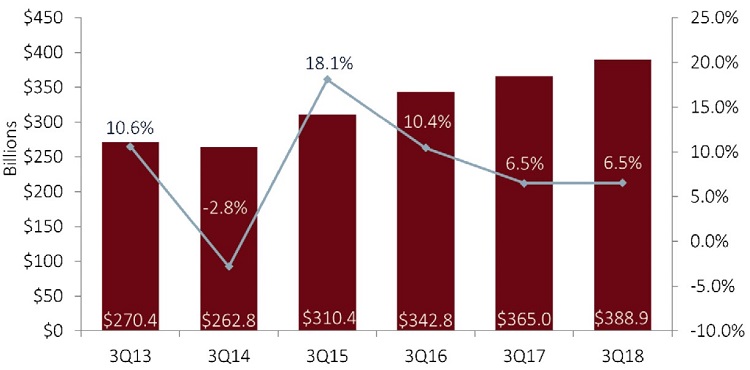
Fueled by strong demand in auto loans, consumer loan originations accounted for 64.9% of total originations and 83.2% of year-over-year total origination growth.
Source: Callahan & Associates.
First mortgage origination growth accelerated 1.0 percentage point annually to 2.4%, the slowest growth of any major origination segment. At $106.8 billion through the third quarter, first mortgages made up 27.5% of total originations. Rates for a 30-year fixed-rate mortgage were up 3 basis points over the quarter to 4.6% as of Sept. 30, 2018.
New home sales have slowed in recent months; however mortgage rates are relatively low with respect to historic levels, Johnson says. Economists at Freddie Mac expect rates to rise through 2019 and into 2020.
Year-to-date, fixed-rate mortgages accounted for the majority 63.9% of first mortgage originations. Balloon and hybrid loans accounted for 24.3%, and adjustable-rate products rounded out the remaining 11.8%. Lower introductory interest rates have historically made adjustable-rate products more appealing to consumers in a rising rate environment, and the share of adjustable-rate products in first mortgage originations has increased nearly 15 percentage points from 21.2% five years ago to 36.1% in the third quarter.
Credit union behavior has also changed. Credit union sales of first mortgage originations to the secondary market have declined over the past several years as the industry increasingly holds more adjustable rate products to hedge against interest rate risk. As a percentage of total first mortgage originations, sales to the secondary market have fallen from a recent high of 40.5% in the third quarter of 2016 to 30.6% as of midyear 2018.
Higher interest rates and improved asset quality make it more profitable for credit unions to hold onto mortgage loans. As such, sales to the secondary market decreased 8.4% year-over-year to $34.5 billion. As of Sept. 30, 2018, credit unions sold 32.3% of total first mortgage originations to the secondary market. During the same period in 2017, the industry sold 36.2% of its total first mortgage originations.
Balance sheet loan growth slowed one percentage point year-over-year to 9.5%. Other real estate loans were the only loan segment of the portfolio in which growth accelerated they were up 82 basis points year-over-year to 6.5%.
LOAN GROWTH BY TYPE
FOR U.S. CREDIT UNIONS | DATA AS OF 09.30.18
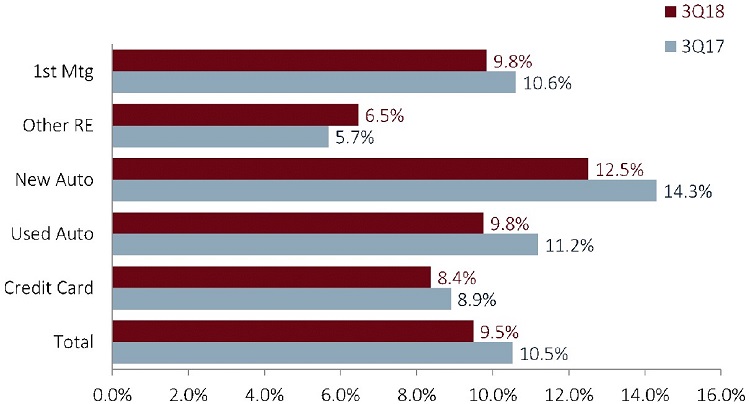
Loan growth decelerated one percentage point year-over-year but was still strong at 9.5%.
Source: Callahan & Associates.
Growth in new auto loans slowed 1.8 percentage points annually to 12.5%. However, the segment still had the highest growth of any loan product. In the past five years, the share of new auto loans in the loan portfolio has increased 3.9 percentage points to 14.9% as of Sept. 30, 2018. Used auto loan balances increased 9.8% year-over-year and reached $219.7 billion. They accounted for 21.2% of the portfolio, up from 19.7% five years ago.
LOAN PORTFOLIO COMPOSITION
FOR U.S. CREDIT UNIONS | DATA AS OF 09.30.18
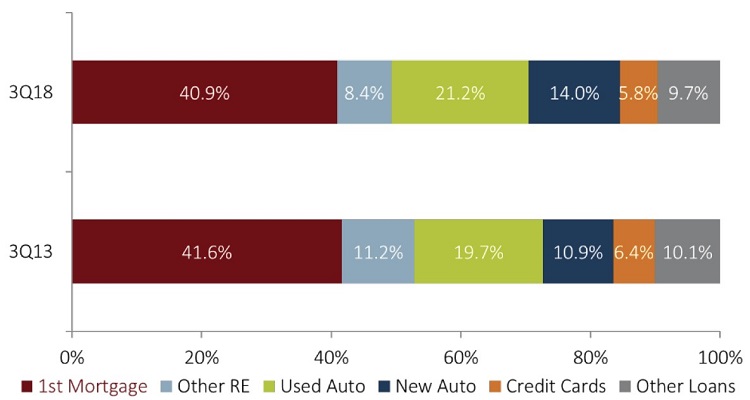
New auto loans grew at a faster annual rate, 12.5%, than any other loan segment.
Source: Callahan & Associates.
First mortgage balances rose 9.8% year-over-year, the fastest-growing product after auto loans, and totaled $425.1 billion as of Sept. 30, 2018. At 40.9%, the share of first mortgages in the loan portfolio outweighed any other product. Although this increased slightly in the past year, the share of first mortgages was down from a high of 41.6% in 2013.
Mortgages are and will continue to be a foundational piece of the credit union loan portfolio, Taft says. Future growth will depend on credit unions’ success in adapting to changing market dynamics, specifically in expanding their reach beyond recapture and refinancing.
Credit unions have expanded market share in the three major loan products auto, mortgages, and credit cards in the past five years annual gains to market share in these key segments continued in the third quarter of 2018.
Credit union auto market share has improved 5.9 percentage points since Sept. 30, 2013. Today, a credit union finances more than one in five auto loans nationally, according to data from Experian.
Indirect lending, which consists largely of auto loans, was up 15.5% year-over-year to $220.4 billion in the third quarter. That’s 3.9 percentage points slower than one year ago. Rising interest rates make loan pricing increasingly important for institutions participating in this space.
Auto lending is an area of expertise for credit unions, Taft says. The industry’s focus on this market will be tested in the coming months as indirect lending slows and margin pressures grow. Pricing discipline will be integral in the coming year.
First mortgage market share has also grown it’s up 2.0 percentage points in the past five years to 8.4%. Credit card market share has increased at the slowest rate among the three products 1.0 percentage point in the past five years to 6.0%.
MARKET SHARE AND 5-YEAR CHANGE
FOR U.S. CREDIT UNIONS | DATA AS OF 09.30.18
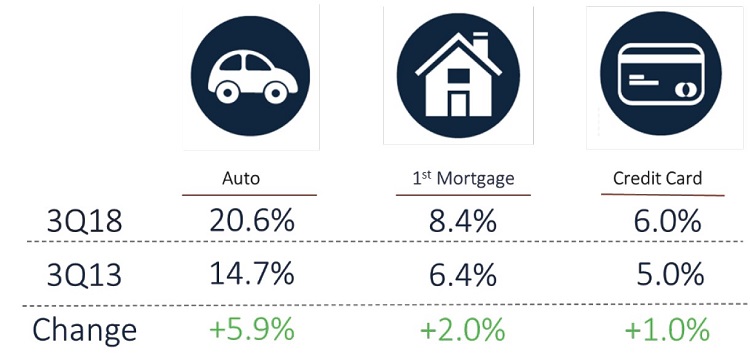
In the past five years, credit unions have expanded market share in the three major loan products.
Source: Callahan & Associates.
Asset Quality
Despite strong loan demand at credit unions across the country, asset quality has not been negatively impacted. Total delinquency was down 12 basis points year-over-year to 0.67% as of Sept. 30. Impressively, credit unions reported year-over-year improvements in delinquency in all loan products save credit cards.
Real estate loans had the lowest delinquency of all loan products. First mortgage delinquency fell 4 basis points year-over-year to 0.53%, and other real estate delinquency decreased 5 basis points during the same period to 0.51%.
Since credit unions began reporting auto delinquency data in 2013, it has remained steady at 0.55% to 0.65%. As of Sept. 30, auto delinquency was down 4 basis points year-over-year to 0.60%.
For now, fears of a potential auto bubble appear to be unfounded, Taft says. As credit unions conservatively and responsibly underwrite their auto loans, they are managing the risk of member default.
DELINQUENCY AND ANNUAL CHANGE
FOR U.S. CREDIT UNIONS | DATA AS OF 09.30.18
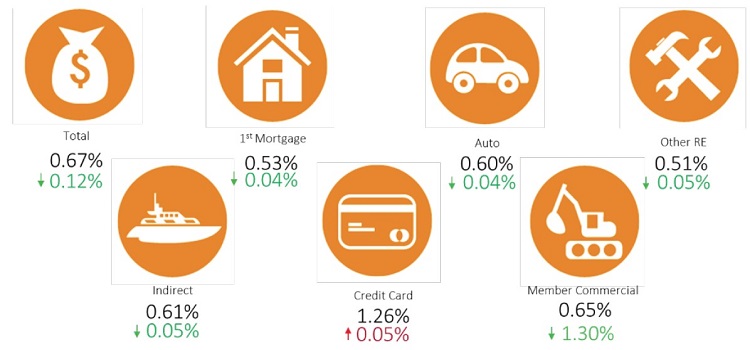
Asset quality has strengthened across the loan portfolio in the past year. Even credit card delinquency rose at a slower rate than one year ago.
Source: Callahan & Associates.
Credit card delinquency, however, is an area to monitor. It was up 5 basis points from one year ago to 1.26% as of the third quarter and has increased year-over-year since 2014. Still, it is important to note that the third quarter delinquency rate was 3 basis points lower than the high of 1.29% reported at year-end 2017.
Credit card delinquency is often seen as a leading indicator of asset quality issues, Johnson says. There is no evidence that overall asset quality is declining, but credit unions will need to continue to monitor their card portfolios and adjust.
Investments
Credit unions held $352.6 billion in investments and cash as of Sept. 30, 2018, down 4.6% from one quarter ago and down 5.4% from one year ago. The quarterly dip in total investments follows historical trends of growth in the first three months of the year followed by declines in subsequent quarters. On an annual basis, credit unions are drawing down investment balances to meet sustained loan demand.
HISTORICAL INVESTMENT COMPOSITION
FOR U.S. CREDIT UNIONS | DATA AS OF 09.30.18
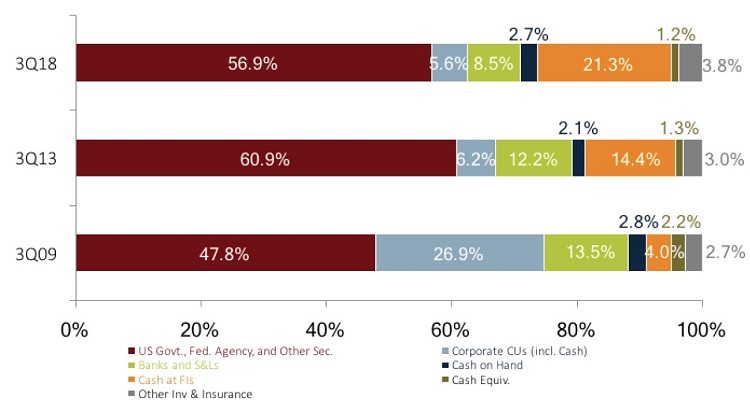
Credit unions are well-positioned to benefit from future rate increases. As of the third quarter of 2018, the industry held 21.3% of its investment portfolio in overnight cash at the Fed.
Source: Callahan & Associates.
In total, cash and investment balances were down $20.2 billion in the third quarter, largely a result of declining Fed balances and cash at corporate credit unions. Down 2.6% quarter-over-quarter, Fed balances dropped to $62.7 billion, although its share of the portfolio increased 36 basis points since June 30. Cash at corporate credit unions contracted 13.5% quarterly to $17.3 billion, and its share of the portfolio dropped 50 basis points. Mutual funds (2.5%), U.S. government obligations (2.2%), and cash on hand (0.5%) were the only components in the investment portfolio for which balances expanded during the quarter. Fed agency MBS remained the largest component of the investment portfolio, and despite the fact balances decreased 3.3%, its share of the portfolio increased 37 basis points quarter-over- quarter to 27.3%.
Every maturity segment declined in the third quarter. Cash and equivalents contracted 10.1% on a quarterly basis. It fell to $92.8 billion as of Sept. 30, 2018, and its share of the investment portfolio fell 1.6 percentage points to 26.3%. Contractions in Fed balances and cash at corporate credit unions played a large role here.
Investments maturing in less than one year contracted 0.1%; those maturing in one to three years contracted 0.3%. These were the smallest quarterly declines in the investment portfolio. Balances in securities maturing in three to 10 years were down 6.0% quarter-over-quarter. Consequently, the percentage of the portfolio allocated to investments maturing in less than three years, including cash, was up 41 basis points to 72.0%.
Balance Sheet: Liabilities
-
Deposit growth slowed 1.7 percentage points year-over-year to 5.0%.
-
Certificate growth accelerated 3.4 percentage points year-over-year.
-
Liquidity tightened as the industry loan-to-share ratio hit a record high of 84.8%.
The Federal Reserve increased interest rates four times in 2018 and has left open the possibility of hiking rates twice more in 2019. Amid these signs of broader economic expansion, loan growth at credit unions has outpaced deposit growth for 22 consecutive quarters. The loan-to- share ratio crept higher again in the third quarter, increasing the emphasis credit unions are placing on bringing in deposits.
Shares
Share balances reached $1.2 trillion as of Sept. 30, 2018. Year-over-year share growth of 5.2% marked the second consecutive year of decelerated growth in the third quarter. As share growth continues to lag behind loan growth, liquidity pressure increases across the industry.
The only product to accelerate, share certificates are becoming a favorite among members as they look to take advantage of rising rates, Johnson says. It is also an important source of additional liquidity to support credit union lending activity.
Share certificate balances expanded faster than any other share product 8.7% year-over-year to $229.3 billion. At 3.4 percentage points, it was also the only segment to post accelerating annual growth and has done so for four consecutive years. Members are keen to make the most of increases in these interest-bearing accounts, and, indeed, 3,148 credit unions in the third quarter increased their certificate dividend rate from the year prior.
SHARE GROWTH BY TYPE
FOR U.S. CREDIT UNIONS | DATA AS OF 09.30.18
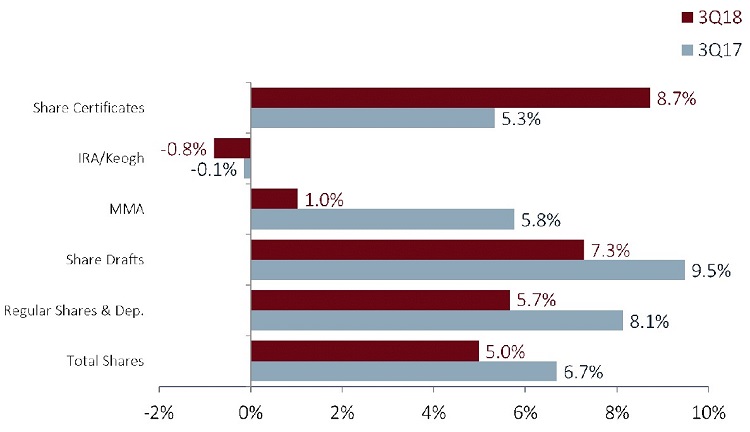
Share certificates were the only share product in which growth accelerated, the result of members capitalizing on interest rate increases.
Source: Callahan & Associates.
At 37.5%, regular shares and deposits comprised the largest portion of the total share portfolio. Up 5.7% annually, regular share balances reached $458.9 billion as of Sept. 30. In the past five years, regular shares have increased their slice of the share portfolio by 3.6 percentage points.
Core deposits which include regular shares, share drafts, and money market shares comprised 74.8% of all shares in the third quarter versus 60% five years ago. They’ve increased $521.8 billion in the past 10 years and account for 95.8% of total share growth.
Core deposits are largely considered sticky’ deposits, Johnson says. Growth in these products is favorable because they are a low-cost source of funds and often lead to deeper relationships.
SHARE PORTFOLIO COMPOSITION
FOR U.S. CREDIT UNIONS | DATA AS OF 09.30.18
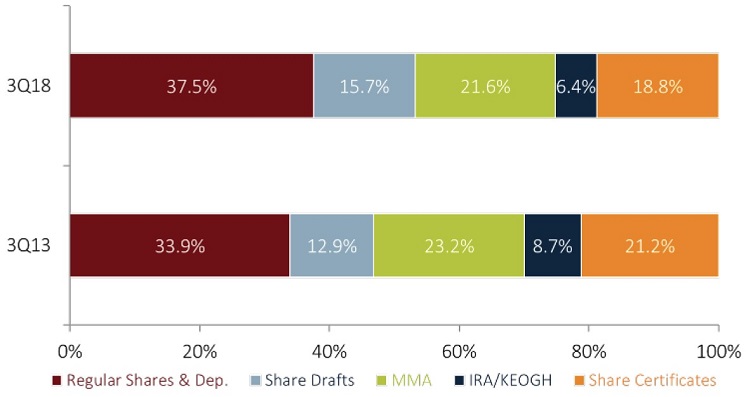
Core deposits – regular shares, share drafts, and money market shares – have increased their slice of the share portfolio 4.7 percentage points in the past five years. They made up 74.8% of the portfolio as of Sept. 30.
Source: Callahan & Associates.
As deposit growth lags behind loan growth, liquidity tightens. The loan-to-share ratio increased 3.5 percentage points annually to reach 84.8% in the third quarter. It has surpassed the previous peak 83.1% recorded in the fourth quarter of 2008. The third quarter marked the 18th consecutive quarter of growth in the loan-to-share ratio. It was up 15.1 percentage points over five years ago and has increased slightly more than 3 percentage points, on average, every year since 2013.
LOAN-TO-SHARE RATIO
FOR U.S. CREDIT UNIONS | DATA AS OF 09.30.18
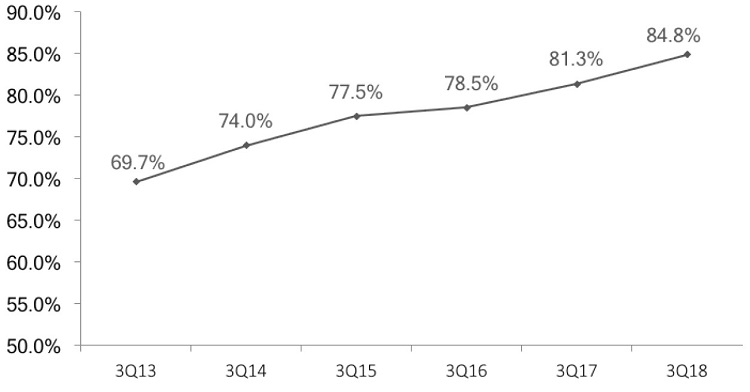
The loan-to-share ratio has risen for each of the past 18 quarters and reached 84.8% in the third quarter of 2018.
Source: Callahan & Associates.
The net liquidity change the net difference between annual deposit and loan growth has decreased $23.6 billion in the past quarter and $31.8 billion in the past year.
Deposit inflows traditionally peak in the first quarter with year-end bonuses and rebates, leading to a positive net liquidity position, Taft says. Deposit growth then slows throughout the year while steady loan growth pushes credit unions into a negative liquidity position.
In the first quarter of 2018, per historical trends, credit union deposit gains outpaced loans and the industry reported a $29.8 billion positive liquidity position. Consecutive quarterly net liquidity deficits in the second and third quarters of 2018 pushed the industry into a negative net liquidity position of more than $20 billion year-to-date.
NET LIQUIDITY CHANGE
FOR U.S. CREDIT UNIONS | DATA AS OF 09.30.18
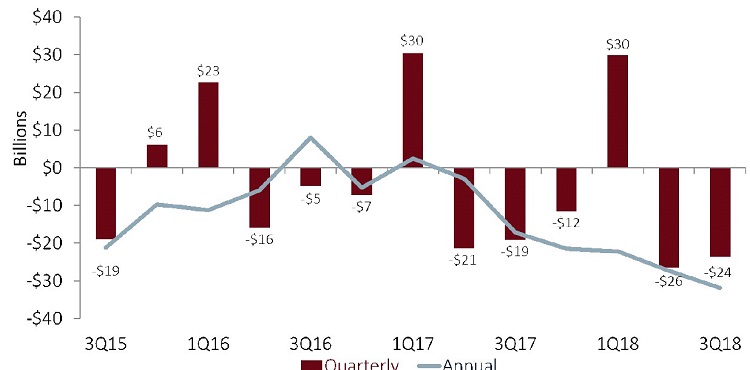
Credit unions should monitor liquidity as they move into a negative position for the fourth quarter of 2018.
Source: Callahan & Associates.
Income Statement
-
Total year-to-date income was up 13.0% over Sept. 30, 2017.
-
Investment income was up 19.9% versus the first nine months of 2017.
-
At 3.12% each, the net interest margin and the operating expense ratio were the same.
Year-to-date total income was $55.0 billion as of Sept. 30, 2018. This is a 13.0% increase over the first nine months of 2017 and marks the third consecutive quarter of double-digit annual growth. Largely a result of rising loan demand coupled with the current interest rate climate, income flows at credit unions are expanding.
Total interest income rose 13.5% year-over-year to $40.2 billion. Consisting of interest from loans and investments, interest income accounted for 73.1% of total income as of Sept. 30, 2018. Through the first nine months of 2018, loan income has grown 12.6% compared to one year ago and investment income has increased 19.9%.
TOTAL REVENUE AND ANNUAL GROWTH
FOR U.S. CREDIT UNIONS | DATA AS OF 09.30.18
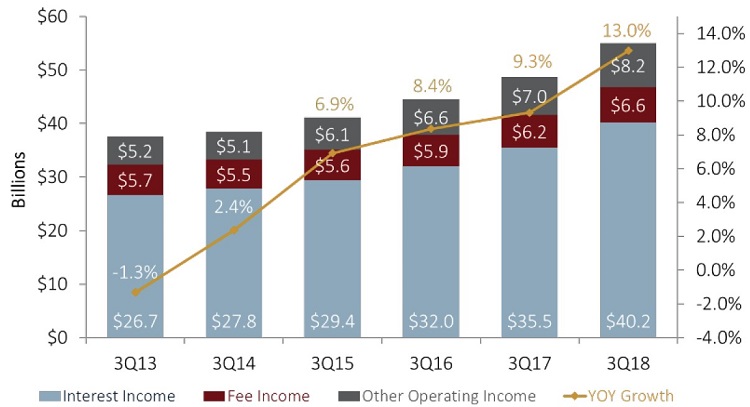
Interest income, which includes income from loans and investments, continued to comprise the majority of credit union income in the third quarter of 2018.
Source: Callahan & Associates.
Non-interest income, largely made up of fee income and other operating income, accounted for the remaining revenue. At $15.1 billion, non-interest income was 11.6% higher than the year-to-date levels recorded in the third quarter of last year. At $6.6 billion year-to-date, fee income rose 5.6%