The new managing director of the International Monetary Fund, Kristalina Georgieva, revealed striking statistics at the institution’s annual meeting in Washington, DC, in October. Two years ago, 75% of the world’s nations reported an uptick in their gross domestic product (GDP). In 2019, 90% face a major slowdown as measured by purchasing power parity.
What might happen to a credit union’s loan portfolio if economic conditions in the United States shifted abruptly? Callahan & Associates is not in the business of predicting recessions; however, the firm can help credit unions determine whether the loans they have on the books or are planning to make are good for individual members as well as the overall membership.
One way to do that is by looking at asset quality, how credit unions are hedging for the future, and where the U.S. economy is heading.
Does Your Lending Strategy Stack Up?
This article features just a few key lending ratios. Go beyond the national averages and dive deeper into individual credit unions, peer groups, state, and more using Peer-to-Peer. Let us walk you through your lending numbers with a custom performance scorecard.
Learn More
Credit Union Lending Trends
First mortgages totaled $81.6 billion and represented more than 26.0% of all loans at credit unions in the second quarter of 2000. As of June 30, 2019, they totaled more than $440 billion and represented 41.1% of the loan portfolio. That’s an increase of over 15.0 percentage points.
Auto loans, too, have played an important role in credit union lending; however, the data doesn’t reflect that at first glance.
At a high level, the share of all auto loans both new and used in the credit union loan portfolio dropped to 34.7% in the second quarter of 2019 from 39.8% in June of 2000. What happened? Increased activity in the housing market from 2000-2011 pushed down auto share by 11.0 percentage points. More than half of this decline occurred from 2007-2011, and, notably, auto share of the loan portfolio peaked at 39.9% in 2001.
LOAN COMPOSITION
FOR U.S. CREDIT UNIONS | DATA AS OF 06.30.19
Callahan & Associates | CreditUnions.com
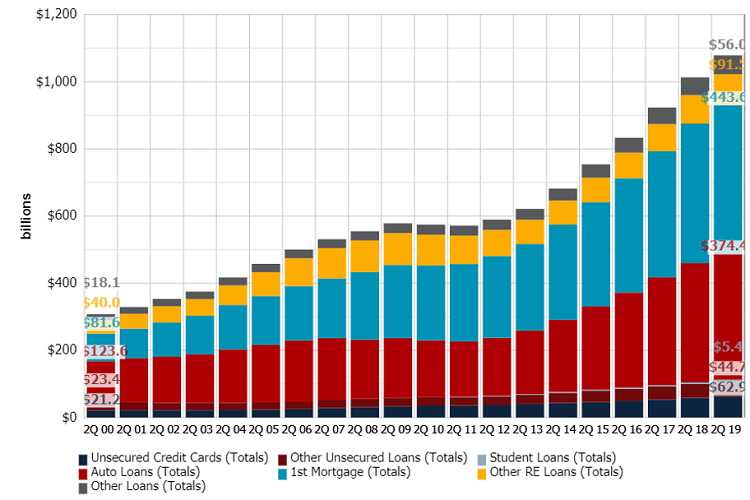
First mortgages and auto loans account for 75.8% of the industry’s portfolio.
Following the decline, credit unions originated a large volume of vehicle loans, and the relative share of the portfolio increased to 35.1% as of June 2018 compared to 34.6% in June 2007. The total dollar amount for all auto loans crossed $374.4 billion as of June 30, 2019. Nearly two decades ago it was $123.6 billion.
ANNUAL CHANGE IN DELINQUENCY
FOR U.S. CREDIT UNIONS | DATA AS OF 06.30.19
Callahan & Associates | CreditUnions.com
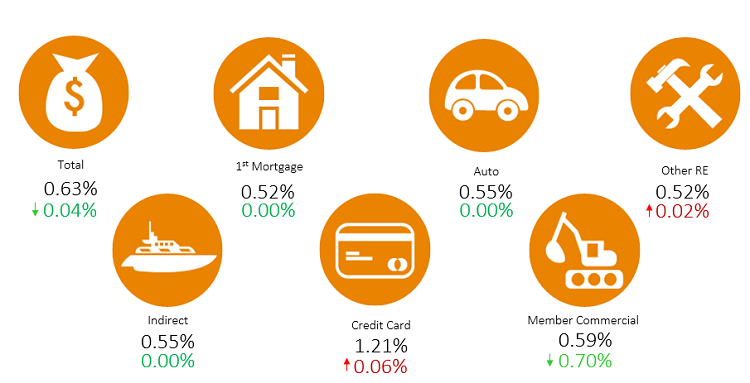
Credit cards and member commercial delinquency see the largest changes year-over-year.
Despite strong lending among credit unions, no alarming trends have developed in asset quality. Credit cards, however, are a stress point. Credit card delinquency was 1.21% as of June 30, 2019. This is almost double the delinquency rate for the total loan portfolio even though credit cards represent only 5.8% of total loans.
By comparison, auto loan delinquency has oscillated within a narrow band of 10 basis points, while first mortgage delinquency at 0.52% has fallen 84 basis points since June 2013.
And finally, last year’s top concern member commercial loan delinquency dropped dramatically because the NCUA liquidated, conserved, or merged a number of credit unions that lent to the taxi medallion industry.
U.S. Loan Performance
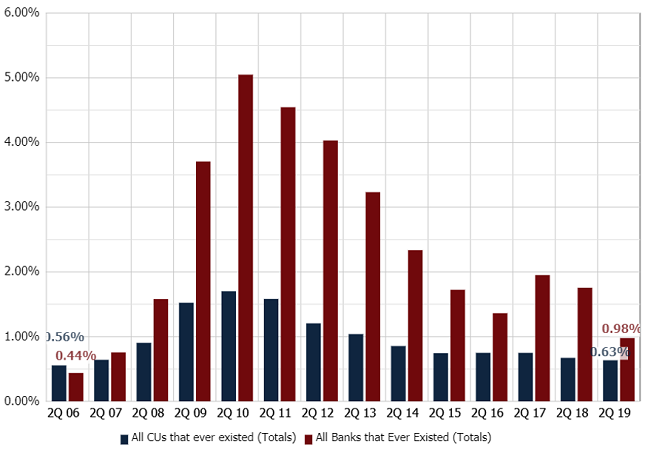
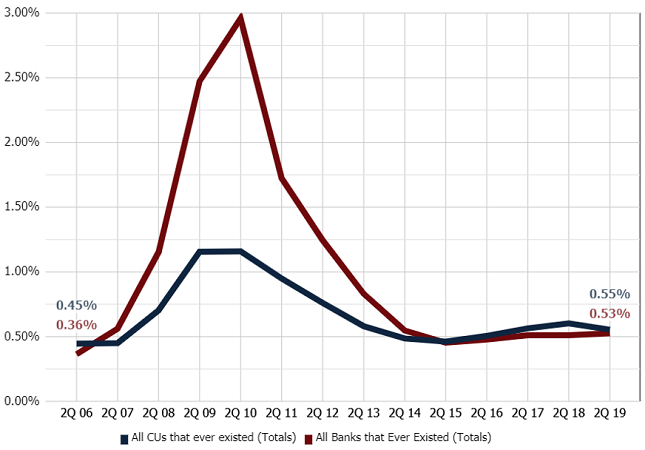
According to the Federal Reserve, total loans (not seasonally adjusted) reached $27.6 trillion in June 2019. Data from Callahan & Associates shows the delinquency rate for banks and credit unions dropped below 1.00%. Credit unions report a similar story in net charge-offs despite the rising level of lending activity.
In 2006, the credit union charge-off rate was 45 basis points, which was 11 basis points higher than the charge-off rate for banks. The financial crisis noticeably shifted this dynamic. One year after the recession formally ended in June 2009, the charge-off rate for banks was 1.8 percentage points higher than for credit unions. The gap between banks and credit unions closed considerably in the post-recession environment, however, and was within 2 basis points 0.53% for banks and 0.55% for credit unions as of June 30, 2019.
DELINQUENCY RATIO
FOR U.S. CREDIT UNIONS AND U.S. BANKS | DATA AS OF 06.30.19
Callahan & Associates | CreditUnions.com
PERCENT CHANGE IN DELINQUENT LOANS
FOR U.S. CREDIT UNIONS AND U.S. BANKS | DATA AS OF 06.30.19
Callahan & Associates | CreditUnions.com
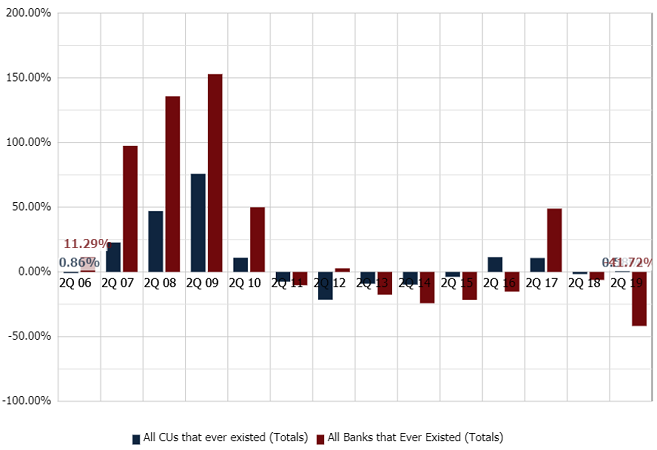
Delinquency has dramatically improved since the Great Recession.
NET CHARGE-OFFS
FOR U.S. CREDIT UNIONS AND U.S. BANKS | DATA AS OF 06.30.19
Callahan & Associates | CreditUnions.com
In the post-recession environment, net charge-offs settled to a similar level at both credit unions and banks.
Financial Well-Being Of U.S. Households
Since the Great Recession, American households have taken significant steps to repair their balance sheets and reduce levels of revolving high-interest debt. Financial obligations slid 3.0 percentage points from its all-time high of 18.1% in October 2007 to 15.0% in April 2019.
HOUSEHOLD FINANCIAL OBLIGATIONS AS A PERCENT OF DISPOSABLE PERSONAL INCOME
DATA AS OF 04.01.19
Callahan & Associates | CreditUnions.com
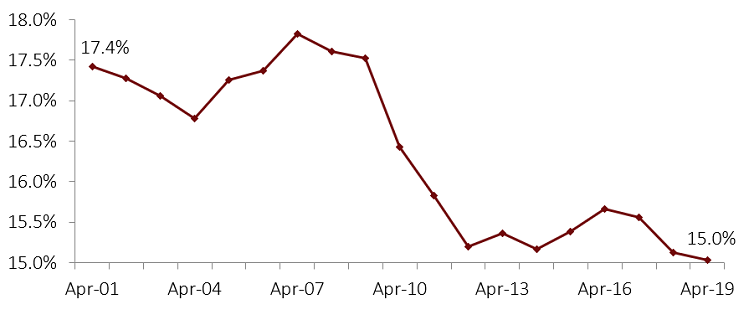
Source: Federal Reserve
Relative consumer debt levels have eased post-crisis.
CONSUMER CREDIT GROWTH OUTSTANDING
DATA AS OF 04.01.19
Callahan & Associates | CreditUnions.com
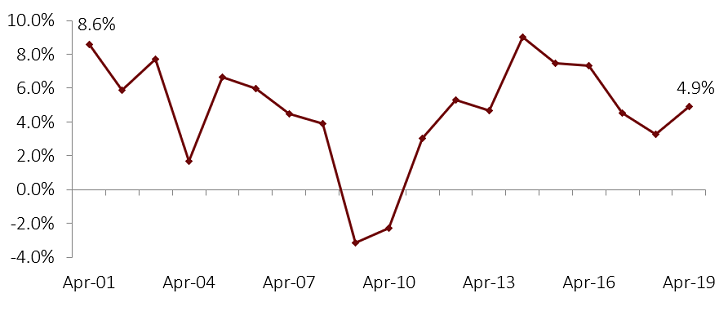
Source: Federal Reserve
Consumer credit growth has risen back to its historical average.
This trend lines up with movement in outstanding credit growth among consumers. Since 2009, growth has risen 8.0 percentage points to 4.9%.
Overall, the data implies households have more robust balance sheets. According to the Federal Reserve’s latest data, the net worth of households reached $107.1 trillion in the second quarter of 2019. This suggests not only that Americans have successfully deleveraged but also that the U.S. economy is generating a massive amount of financial assets over time, which allows more people to live comfortably.
It’s worth noting if disaggregating the data by characteristics such as generation or race would likely paint a distinctly different picture of well-being.
What’s The Industry Banking On?
To recap, this piece has covered lending trends, loan performance, and household balance sheets. A look into how the industry is hedging can also be of value.
The coverage ratio, which measures the allowance for loan losses relative to total delinquent loans outstanding, is one metric that helps bridge the gap between current and expected future losses. As of June 30, 2019, the industry had reserved $1.38 for every $1 in delinquent loans.
COVERAGE RATIO
FOR U.S. CREDIT UNIONS AND U.S. BANKS | DATA AS OF 06.30.19
Callahan & Associates | CreditUnions.com

Banks loss reserves have increased in recent years.
Year-over-year, credit unions and banks grew more conservative. The coverage ratio for banks surged 55.4 percentage points compared to 2.7 percentage points for credit unions. Ultimately, how a credit union manages its allowance account is a function of member demographics, loan performance trends, internal strategies and risk tolerances, and the state of the overall economy. However, it’s clear, even in a deregulatory environment, industry behavior is shifting.
What’s Next?
It’s difficult to make sound decisions without understanding where the U.S. economy is heading. The United States likely will have a hard time maintaining the strong economic performance displayed between 2015-2019.
Here are three reasons why:
- Volfefe Index: The name might be a dig at covfefe, but serious thought has gone into it. According to JP Morgan, certain tweets by President Trump have a statistically significant impact that many market watchers haven’t fully come to terms with. The economic impact is showing up in implied volatility, which affects the pricing of products such as options and securities. It’s plausible there will be a significant uptick in market uncertainty between now and 2021 as a result of political developments.
- Federal Funds Rate: Currently, the Federal Reserve is concerned inflation will undershoot its target. Its pessimism boils down to the global economic slowdown and market anxieties surrounding trade. The consequence of an inflation rate that is too low is an economy that is too weak. Per the Federal Reserve Bank of Atlanta’s market tracker, the probability of an additional 25-basis-point rate cut averaged approximately 87% for contracts expiring between December 2019 and September 2020. The intended goal of a rate cut is to keep the recovery going; however, interest rates are already low.
- Long-term economic trends: The United States has been grappling with a slowdown in productivity as well as endogenous demographic shifts i.e., a higher ratio of older Americans for years. Economic growth (real potential GDP) can be broken down in simple terms as the sum of labor productivity plus population growth. This makes it next to impossible for the United States to sustain growth at 3% outside of a quarter here or there. If consumer spending which is an estimated 70% of the U.S. economy declines, then there’s nowhere to go but down. That’s problematic given that in recent years U.S. growth hovered around 2%.