It’s reporting season, and Callahan’s FirstLook provides an early look at credit union data. Looking for crucial insight into quarterly performance results weeks before the official data release? Callahan & Associates has you covered. Catch up on the latest trends below or dive deeper into the trends that matter to you with Peer Suite, Callahan’s online performance benchmarking tool. Schedule your demo today.
According to this quarter’s FirstLook performance figures, what’s notable about first quarter performance? And what does it suggest about today’s trends?
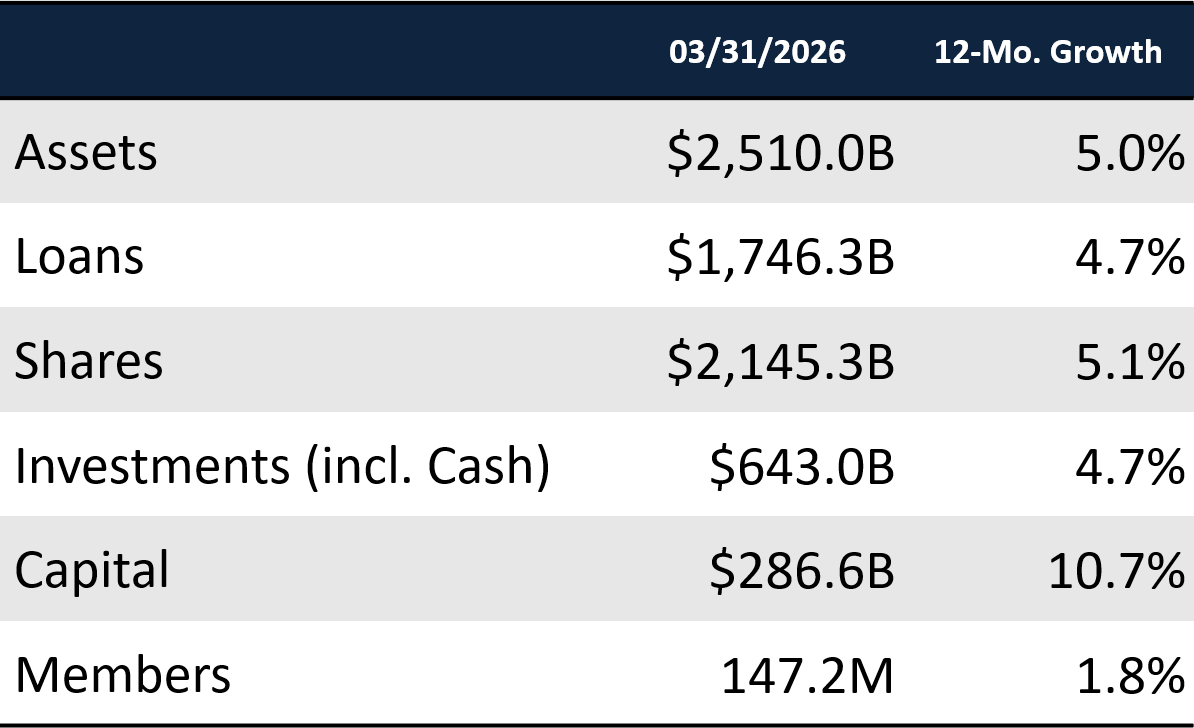
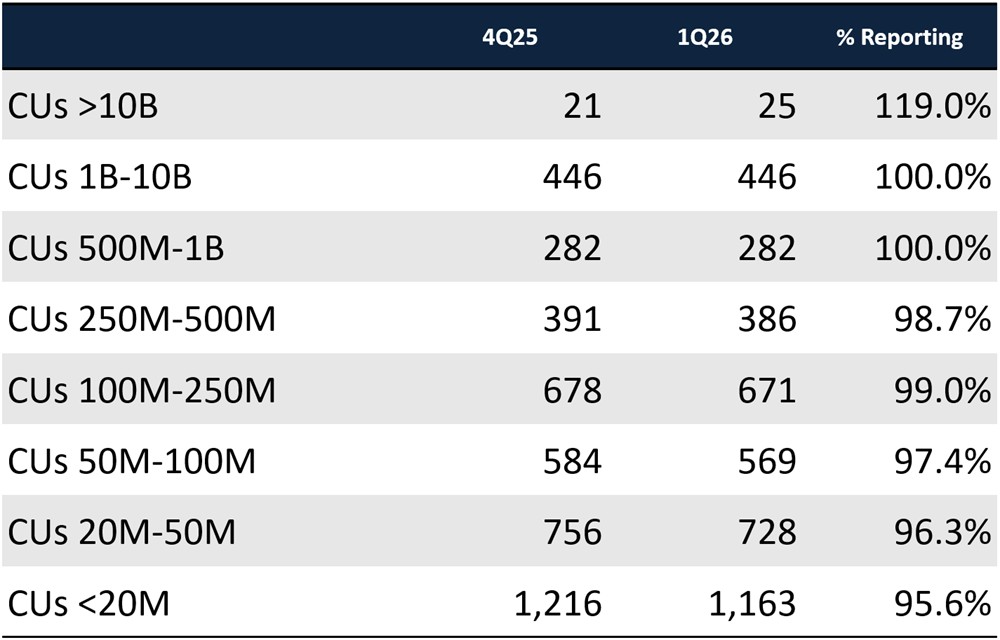
05.08.26 Update
-
- Lending activity is warming up after a few years of higher rates and saturated markets that cooled purchase and refi volumes. However, the rebound is uneven across products. First mortgage balances are leading portfolio growth at 5.8% annually, outpacing overall loan growth of 4.7%, with moderately lower rates as the primary driver. HELOCs are the standout performer in relative terms, expanding 14.6% annually and reinforcing their appeal as a flexible, affordable liquidity tool for homeowners — though they remain a smaller share of the overall portfolio. Similarly, real estate originations are up 28.4% year over year, well ahead of balance growth alone.
- Key Takeaway: Members appear increasingly active in the housing market, and importantly, many seem to be staying with their credit union when they refinance or purchase, a strong sign of member retention and loyalty.
- In other loan sectors, commercial lending contributes to overall growth, though auto lending remains constrained. New auto balances declined 2.2% year-over-year as captive (manufacturer-owned) lenders undercut credit unions and banks with below-market rates to move inventory — a common tactic when auto demand is soft. This is akin to a sale from manufacturers, who are often more focused on moving vehicle inventory than generating financing income, allowing captive lenders to offer below market promotional rates when demand softens. Used auto lending remains positive at 1.1% annual growth, though the industry’s broader pullback from indirect lending continues to moderate market share expansion.
- Key Takeaway: Tariffs have added further strain to the market, limiting the ability of credit unions and banks to compete effectively.
- Deposit behavior suggests members are slightly reallocating their funds. Share certificate balances drove growth over the past year at 6.3%, but the composition of that growth is shifting. Both long-term certificates (3+ years) and short-term certificates (<1 year) declined as a share of total balances, indicating funds are moving into more flexible, medium-term options. At the same time, credit card utilization declined sharply in the first quarter as members paid down holiday balances, even as available credit lines expanded.
- Key Takeaway: Members appear to be using their tax returns by balancing debt reduction and the desire to capture remaining elevated deposit yields before rates fall further.
- Balance sheet positioning remains cautious despite improving activity. The loan-to-share ratio declined to 81.4%, down 1.8 percentage points from year-end, as deposit inflows continue to outpace loan demand. As a result, credit unions are holding more liquidity, with cash rising 67 basis points to 8.83% of assets. At the same time, accumulated unrealized losses increased for the first time in over a year, reflecting shifting market conditions as rates adjust.
- Key Takeaway: Lending activity is beginning to return and members are actively managing their finances, though both behaviors remain measured rather than fully confident. Credit unions, in turn, are maintaining flexibility, suggesting that while conditions are improving, institutions are still preparing for multiple paths forward.
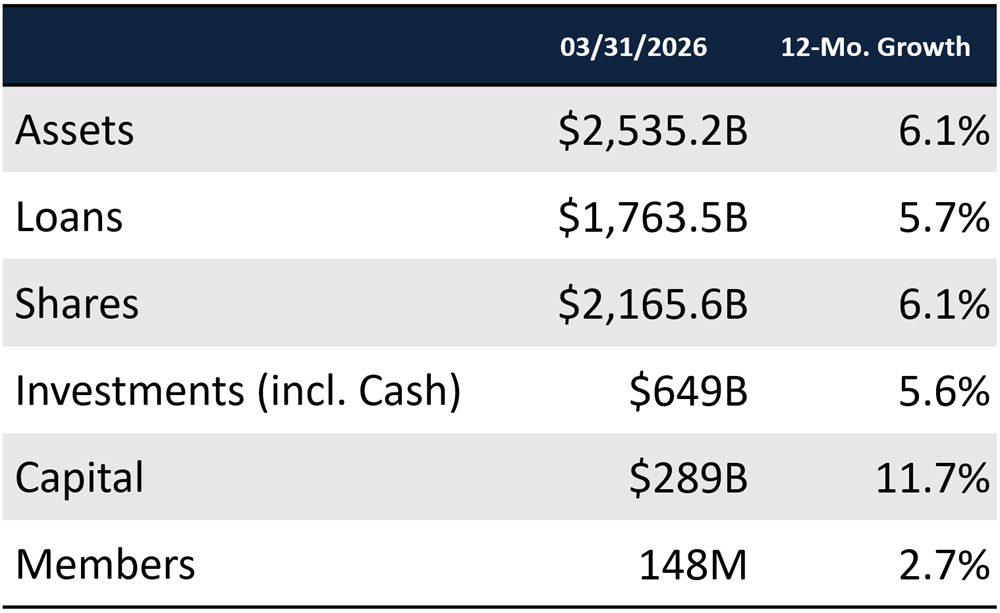
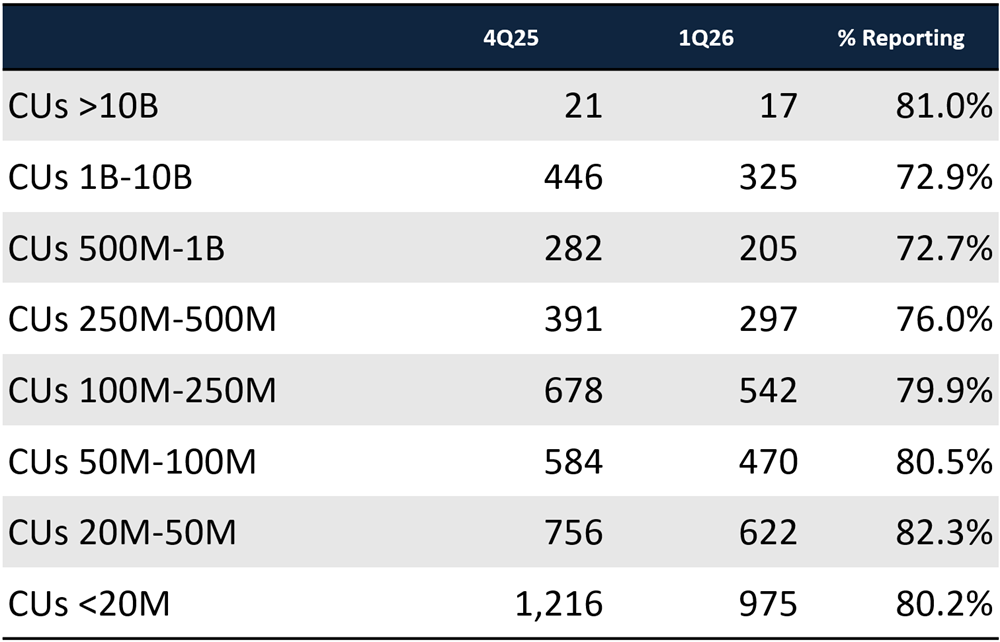
05.04.26 Update
- The falling interest rate environment is starting to leave its mark, although so far mostly to the benefit of credit union margins. The cost of funds is on track to fall sharply to 1.92%, down 13 basis points from year-end 2025, whereas loan yields have held fairly steady at 6.10%. The net interest margin has expanded to 3.43% as a result. That’s up 4 basis points over the quarter. Meanwhile, the operating expense ratio has dropped slightly to 3.11%. All told, the rare dynamic of interest margins outpacing operating expenses continues, meaning credit unions have some operational buffer to try new things to help members. ROA rose to 0.84% (annualized), up 5 basis points over the quarter.
- Key Takeaway — Deposit costs appear to be repricing downward faster than loan yields are adjusting, meaning credit unions might be able to take advantage of elevated rates even as the Fed cuts. However, past trends indicate loan yields do eventually follow drops in the federal funds rate.
- Balance sheet growth is also accelerating once again. Share growth is set to climb to 6.13% annually, up 64 basis points from year-end. Share growth often performs well in the first quarter as tax returns bolster member savings. Even with lower rates, money market and share certificate accounts continue to lead deposit growth, which could signal improving household confidence and members’ attempt to capture the last of the falling rates.
- Key Takeaway — Member savings is up and credit unions, on average, are not spending as much to retain and attract deposits. Consequently, the cost of funds is falling faster than loan yields. It is another encouraging sign for member financial health, although credit union leaders should consider the transient impact of tax returns on these results.
- Loan balance growth is set to grow 5.7% annually and asset quality is showing seasonal improvements, yet another reflection of member health. Delinquency has declined from the record levels reached at year-end, with the largest improvements coming in credit cards, autos, and first mortgages. First mortgage delinquency alone declined roughly 30 basis points quarter-over-quarter. However, it is difficult to determine whether this is a lasting improvement in household finances or the temporary effects of tax refunds and seasonal cash flow normalization. Although repayment trends improved during the quarter, households still face pressure from higher costs in essential areas like energy, insurance, and other day-to-day services.
- Key Takeaway — Loan demand is healthy, especially in real estate thanks to lower rates, and repayment rates are improving. These are encouraging signs for member health, demand for credit union services, and sustainable budgeting. However, whether those improvements continue after the first quarter remains an open question.
 Trendwatch 1Q26. Go beyond the numbers to understand what performance results suggest about risk, resilience, and opportunity across the movement. The insights shared during this session are designed to support confident decision‑making and strengthen leadership conversations throughout the organization. Register for Trendwatch today.
![]() CreditUnions.com updates this page with the freshest FirstLook credit union performance data every quarter, so don’t forget to come back for more insights.
CreditUnions.com updates this page with the freshest FirstLook credit union performance data every quarter, so don’t forget to come back for more insights.