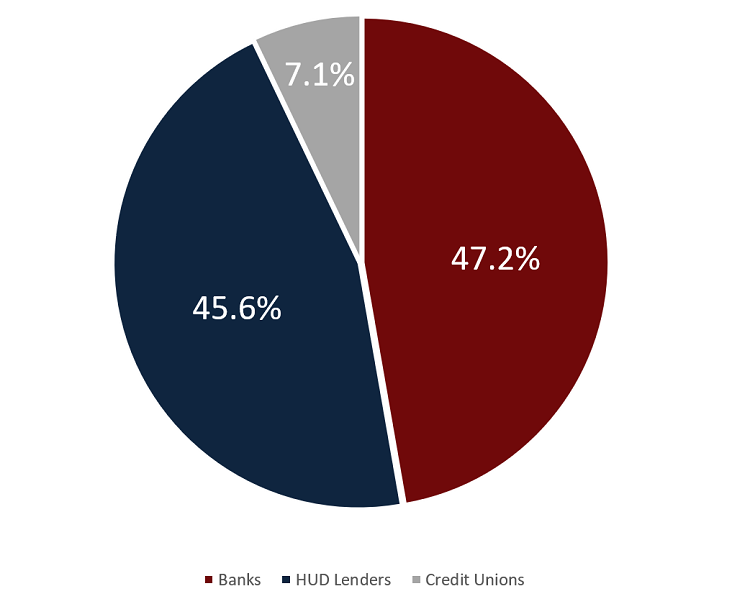
Mortgage production in the United States approached $2.0 trillion at year-end 2018, according to newly released data from the Home Mortgage Disclosure Act (HMDA). Credit unions accounted for $142.2 billion, or 7.1%, of the total market.
HMDA data captures closed-end purchases, refinances, and home improvement loans. Open-end lines of credit are also included as newly mandated by HMDA for the 2018 reporting year.
Banks and HUD lenders including mortgage finance companies respectively accounted for 47.2% and 45.6% of all loan dollars originated. Those numbers drop a bit when it comes to market share for the total number of mortgage loans made in 2018. Here, banks captured 43.4% of the market whereas HUD lenders captured 44.3%. Conversely, credit unions handled 7.1% of all loan dollars originated in 2018 but originated 12.3% of the total number of loans. Making smaller loans to more borrowers highlights the credit union mission to support local members.
MORTGAGE ORIGINATION MARKET SHARE
DATA AS OF 12.31.18
Callahan & Associates | CreditUnions.com

Credit unions nationwide funded 7.1% of mortgage origination value in 2018, which accounted for 12.3% of the total number of loans.
Source: Home Mortgage Disclosure Act (HMDA)
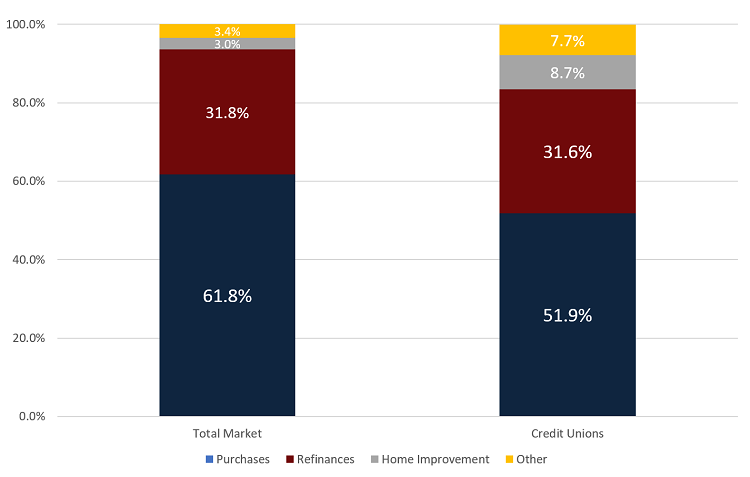
Purchases comprised 61.8% more than $1.2 trillion of all mortgages originated in 2018, reflecting the desire of buyers to lock in lower rates during last year’s rising-rate environment. The remaining portfolio was divided among refinances (31.8%), home improvement (3.0%), and other (3.4%). Another new category in 2018 HMDA report requirements, other encompasses all real estate-backed loans used for purposes other than the previous three categories.
Among U.S. credit unions, purchases made up a smaller portion, 51.9%, of total mortgage loans. However, cooperatives continued to thrive in the relationship-based loan categories of refinances (31.6%), home improvement (8.7%), and other (7.7%).
MARKET SHARE BY LOAN PURPOSE
DATA AS OF 12.31.18
Callahan & Associates | CreditUnions.com

The refinance, home improvement, and other loan categories account for 48.0% of all mortgage lending at U.S. cooperatives, reinforcing the relationship-based strategy of credit union lending.
Source: Home Mortgage Disclosure Act (HMDA)
Another new category added to 2018 HMDA reporting is one that indicates whether a borrowed used the loan to purchase a principal residence, secondary residence, or investment property. Not surprisingly, principal residence loans made up 79.0% of the total with investment properties and secondary residences making up 17.2% and 3.8%, respectively. Here, again, credit union performance reinforces the personal nature of their member relationships. A full 91.8% of mortgage loans made by credit unions went toward primary residences. Investment properties and secondary homes accounted for 5.7% and 2.5%, respectively, of the remaining loans.
Cooperatives in the Midwest continued to dominate the credit union industry in mortgage market share. Nine of the top 10 MSAs by credit union market share were located in Iowa, Wisconsin, Minnesota, Illinois, or Michigan (minimum $500 million in originations).
CREDIT UNION MARKET SHARE BY MSA
DATA AS OF 12.31.18
Callahan & Associates | CreditUnions.com
| Rank | MSA Name | State | Loans ($000s) | CU Orig. | CU $ Mkt Sh. |
|---|---|---|---|---|---|
| 1 | WATERLOO-CEDAR FALLS | IA | $659,000 | $387,100 | 58.7% |
| 2 | CEDAR RAPIDS | IA | $1,366,075 | $671,275 | 49.1% |
| 3 | IOWA CITY | IA | $1,126,240 | $474,155 | 42.1% |
| 4 | LA CROSSE-ONALASKA | WI/MN | $668,195 | $248,235 | 37.2% |
| 5 | DAVENPORT-MOLINE-ROCK ISLAND | IA/IL | $1,394,835 | $509,985 | 36.6% |
| 6 | EAU CLAIRE | WI | $751,810 | $261,055 | 34.7% |
| 7 | KALAMAZOO-PORTAGE | MI | $1,424,945 | $489,775 | 34.4% |
| 8 | APPLETON | WI | $1,158,310 | $381,360 | 32.9% |
| 9 | KINGSPORT-BRISTOL | TN/VA | $873,040 | $278,215 | 31.9% |
| 10 | MADISON | WI | $4,535,350 | $1,408,015 | 31.0% |
Midwest credit unions originate a higher percentage of total mortgages in the market compared to other areas of the country.
Source: Home Mortgage Disclosure Act (HMDA)
The addition of open-ended loans which are disproportionally weighted toward borrowers that have an existing relationship with the lender to HMDA reporting requirements provides deeper insight into credit union real estate lending. These types of loans are a credit union specialty.
Callahan & Associates will release more information on year-over-year growth on CreditUnions.com in the coming weeks. In the meantime, clients are encouraged to use MortgageAnalyzer to analyze the HMDA dataset in a clean, user-friendly format.
Is Your Mortgage Lending Strategy Working?
Home Mortgage Disclosure Act (HMDA) data was recently released. With the help of MortgageAnalyzer, you will be able to see the complete picture of leaders and laggards in mortgage lending and gather insight into the local mortgage market. Let us show you how you can create a winning mortgage lending strategy.
Learn More


