Share draft penetration is an indication of how many members hold a checking account at their credit union. It is calculated by dividing the number of share draft accounts by the number of members and is a major indicator of whether a credit union holds a member’s primary financial relationship.
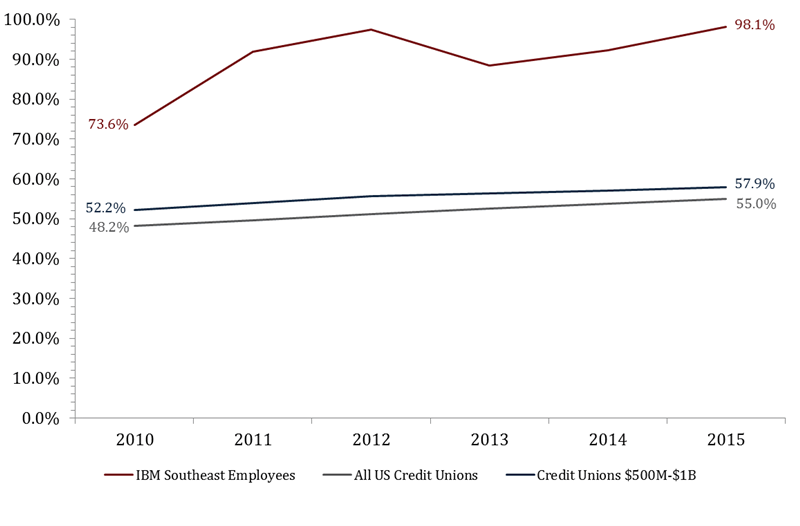
According to Callahan & Associates’ Firstlook program in which 5,042 credit unions representing 88.9% of industry assets are reporting share draft penetration for third quarter 2015 has topped 55.0%. This is a 70-basis-point year-over-year increase and the result of the industry’s share draft growth of 6.4% outpacing its 3.8% member growth.
With a share draft penetration of 98.1%, IBM Southeast Employees’ Credit Union ($881.3M, Boca Raton, FL) outperformed both national and asset-based peers. Although membership declined slightly, -0.03% annually, the number of share draft accounts increased 6.1%.
SHARE DRAFT PENETRAION
For all U.S. credit unions | Data as of 09.30.15
Callahan & Associates | www.creditunions.com
Source: Peer-to-Peer Analytics by Callahan & Associates
Among credit unions with assets ranging from $500 million to $1 billion, IBM Southeast Employees’ ranks fourth in share draft penetration and has expanded the metric by 5.9 percentage points annually.
Credit unions in this peer group on average had a share draft penetration of 57.8%, up 43 basis points year-over-year.
SHARE DRAFT PENETRAION
For FirstLook credit unions $500M-$1B in assets | Data as of 09.30.15
Callahan & Associates | www.creditunions.com
| Rank | State | Credit Union | Share Draft Penetration September 2015 | Share Draft Penetration September 2014 | Year-Over-Year Change |
|---|---|---|---|---|---|
| 1 | DC | IDB-IIC | 108.9% | 108.0% | 0.9% |
| 2 | CA | Pacific Marine | 105.2% | 105.6% | -0.4% |
| 3 | FL | Power Financial | 104.5% | 96.2% | 8.3% |
| 4 | FL | IBM Southeast Empl. | 98.1% | 92.2% | 5.9% |
| 5 | VA | 1st Advantage | 91.7% | 55.5% | 36.2% |
| 6 | CA | Arrowhead Central | 84.8% | 83.2% | 1.6% |
| 7 | FL | Tropical Financial | 83.6% | 91.2% | -7.6% |
| 8 | CA | USE | 81.7% | 78.1% | 3.5% |
| 9 | NV | One Nevada | 81.0% | 62.2% | 18.1% |
| 10 | WI | Westconsin | 79.4% | 71.1% | 8.3% |
| Peer Group Average | 57.9% | 57.5% | 0.4% | ||
Source: Peer-to-Peer Analytics by Callahan & Associates