The credit union industry’s investment portfolio increased 1.6% year-over-year, with investments totaling nearly $384.5 billion at the end of second quarter 2017.
Investment growth at credit unions has been positive for four out of the past six quarters; however, the tepid growth in the recent second quarter is indicative of credit unions’ continued focus on their lending operations. At times, the nation’s financial cooperatives have diverted assets from the investment portfolio to fuel higher-yielding loan growth.
Total borrowings for the industry was $48.3 billion at midyear. This represents a 2.1% growth over last year’s borrowings but pales in comparison to the 7.6% year-over-year growth rate of total assets. As such, borrowings as a percentage of assets has decreased to 3.5%.
How do your investment metrics compare to industry averages and the leaders below? Find out in no time with Peer-to-Peer.
As interest rates gradually move upward, investment yields likewise post steady gains. As of June 30, 2017, the yield on average investments was 1.54%. That’s an improvement of 10 basis points over first quarter and 20 basis points over June 30, 2016. This quarter’s yield was the highest since Dec. 31, 2011.
Although investments posted year-over-year growth, they declined 4.4% quarter-over-quarter, which is typical of second quarter. The quarterly change brought with it an adjustment in maturities as well, with notable decreases in holdings of cash and cash equivalents. The share of cash in the investment portfolio fell to 27.5%, down from 30.6% in the first quarter.
Investments with maturities of three to five years increased during the second quarter, and, at $71.5 billion, now make up 18.6% of the investment portfolio. Much of the investment portfolio, 48.06%, still firmly lies in investments with securities less than one year.
Total industry investments in U.S. Government Obligations increased from $10.3 billion to $14.4 billion. That’s a YOY upturn of 40.7%. Other notable annual increases in the investment portfolio include NCUA guaranteed notes, which notched up 12.6%, and cash at corporate credit unions, which rose 7.2%. Fed Agency MBS and debt instruments still accounted for the largest percentages of the investment portfolio at 26.9% and 18.6%, respectively.
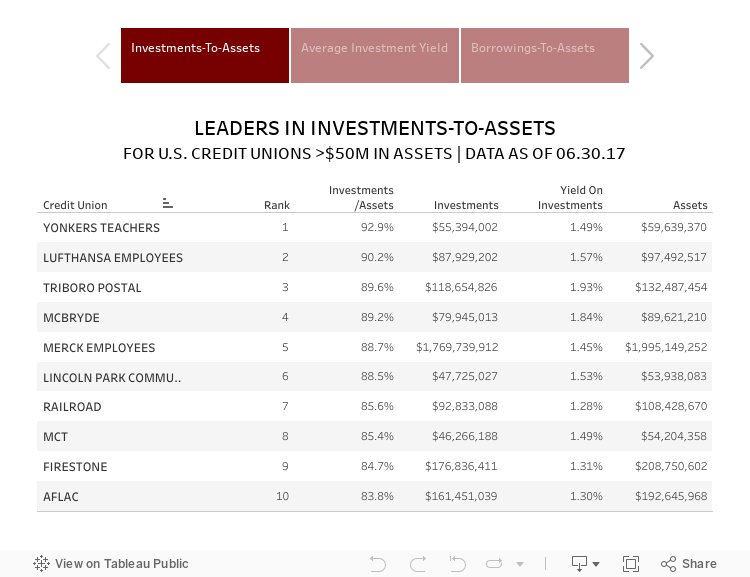
Click through the tabs below to see the top 10 credit unions in each leader table.
var divElement = document.getElementById(‘viz1514324580133’); var vizElement = divElement.getElementsByTagName(‘object’)[0]; vizElement.style.width=’750px’;vizElement.style.height=’577px’; var scriptElement = document.createElement(‘script’); scriptElement.src = ‘https://public.tableau.com/javascripts/api/viz_v1.js’; vizElement.parentNode.insertBefore(scriptElement, vizElement);
See the rest of these tables and explore dozens more along with hundreds of pages of credit union performance data in the 2018 Callahan Credit Union Directory. It’s the gold standard for reliable insight. Read the digital download today.
CASE STUDY
Building Revenue Through Swaps And Hedges
Purdue FCU | West Lafayette, IN | Assets: $1.1B | Members: 73,065
Purdue Federal Credit Union is using rate swaps and hedging to simultaneously dampen interest rate risk and generate revenue.
Purdue Federal began interest rate swaps shortly after the NCUA granted the credit union derivative-trading approval in December 2015. Since then, the Indiana credit union has generated approximately $1.5 million in extra interest income from the loans it has been able to hold rather than sell.
These swaps are basically agreements between the credit union and a trading partner to trade one stream of interest payments for another over a set period. Derivative contracts have allowed Purdue Federal to hold an additional $80 million in first mortgages in a real estate loan portfolio that grew 18.71% year-over-year to $628.42 million in the second quarter of this year.
Meanwhile, the credit union expects its mortgage pipeline hedging strategy to add 3 basis points a year to its ROA.
Purdue Federal works with an outside advisor to administer the programs, which helps the credit union provide rate locks to members while mitigating risk from rising interest rates. The strategy involves evaluating new loans daily, lowering risk by taking daily losses and gains while committing the mortgages to future sales as much as 120 days out at a to-be-announced price.
That helps dampen the market risk that occurred when Purdue Federal was selling loans to Fannie Mae with the typical 45-day delivery date. The four interest rate swap transactions the credit union currently has on its balance sheet helps reduce risk even more.
Whereas these kinds of debt and trading instruments are considered quite liquid and fairly plain vanilla in trading circles, they’re not for amateurs.
I wouldn’t recommend going out and trying to do these yourselves, says Brian Musser, Purdue Federal’s CFO since 1991.
He says some effort was involved in getting the programs up and running, and now that it is, Purdue Federal depends on its outside advisor to manage the swaps and trades.
How Do You Compare?
NCUA and FDIC data is right at your fingertips. Build displays, filter data, track performance, and more with Callahan’s Peer-to-Peer analytics. More insightful performance comparisons start here.
![]()