Read the full analysis or skip to the section you want to read by clicking on the links below.
LENDING AUTO LENDING MORTGAGE LENDING CREDIT CARDS MEMBER BUSINESS LENDING SHARES INVESTMENTS MEMBER RELATIONSHIPS EARNINGS SPECIAL SECTION: CUSOS
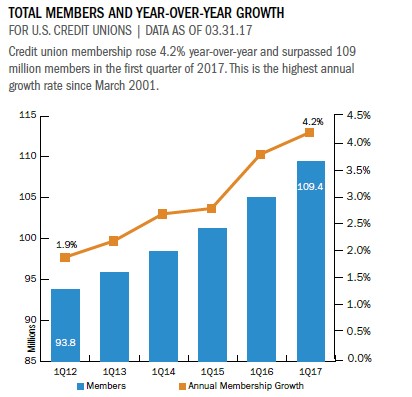
Credit union membership was 109.4 million as of March 31, 2017. That’s nearly 4.4 million more members than 12 months ago. Member growth has steadily improved during the past five years. In first quarter 2012, member growth was 1.9%. This quarter’s growth rate of 4.2% was the highest credit unions have posted since first quarter 2001. Growth is strongest among credit unions with more than $1 billion in assets; they added 4 million members in the past year.
Credit unions spent on average $83 in the first quarter on educational and promotional expenses per net new member to increase member rosters. Much of this spend depends on size and region. For example, credit unions in the NCUA’s Central region spent $116 on marketing expenses for each new member; that’s more than double what Mid-Atlantic credit unions paid for each net new member.
There is a negative correlation between credit union size and marketing expense per new member. For example, credit unions with more than $1 billion in assets spent $55 per member versus the $241 per new member that credit unions between $50 million and $100 million in assets spent.
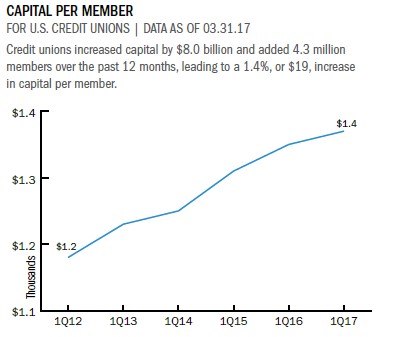
Credit union members held, on average, $18,073 in savings and loan products with their credit union in the first quarter of 2017. That’s up 4.8% over March 31, 2016. Credit unions in the NCUA’s Western region had the highest average member relationship at $20,561 but their 5.4% growth rate came in second behind the 5.5% posted by Southeastern credit unions.
Callahan’s Peer-to-Peer quickly shows how your credit union stacks up against peers for key member-centric metrics. Learn more today.
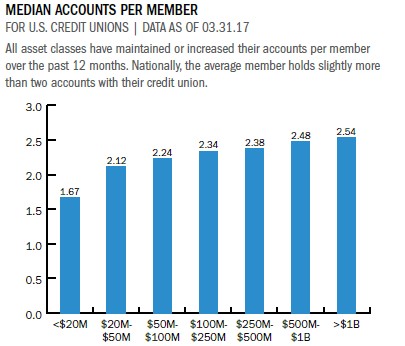
Members have on average 2.5 accounts; the median is 2.08. Each NCUA region has between 2.4 and 2.5 accounts per member, on average, but variability exists at the asset level. Overall, there is a positive relationship between size and average accounts, as larger credit unions have members with more accounts than their smaller counterparts. The median account per member at America’s largest credit unions came in at 2.5, whereas the median for the country’s smallest credit unions was 1.7 accounts per member.
Click the graphs below to enlarge and then continue reading to see how a lean, not mean, operation helps Boston Firefighters Credit Union top the charts in member metrics.

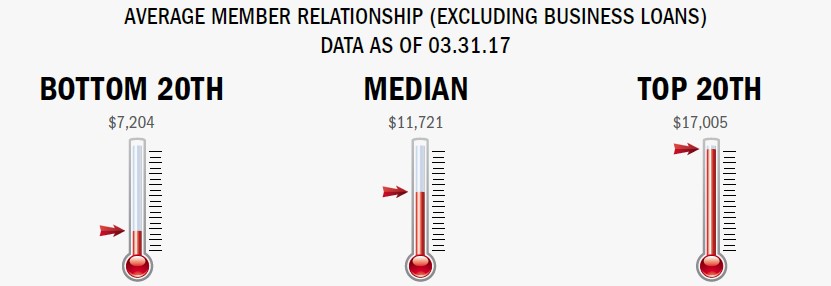
Larger institutions underpinned the growth in average loan balances across the country. Whereas the median growth rate increased 2.8 percentage points, credit unions in the top 20th percentile posted gains of 9.6% per loan.
CASE STUDY
BOSTON FIREFIGHTERS CREDIT UNION
When it comes to providing for members, Boston Firefighters Credit Union looks beyond the traditional safety and soundness issues covered by CAMEL scores and regulator examinations.
For the past decade, BFCU has considered closely Callahan’s proprietary Return of the Member (ROM) index, which measures member value via loan rate, savings rates, and member service usage.
BFCU tops the ROM chart, scoring 99.71 out of 100 among credit unions with $250 million to $500 million in assets as of March 31, 2017.
ROM scores are in our goals as a management team, says CEO Bernie Winne. ROM helps determine how we calculate our bonuses at the end of the year.
According to Winne, many of the other goals tied to the management team’s year-end bonus program are financial goals such as the credit union’s return on assets. ROM provides a nice counterbalance to keep the members’ interest inmind.
If you’re trying to drive ROA, there are a number of ways to achieve that, he says. Some of those strategies are not member friendly. In a way, ROM stops management from making their goals on the backs of the membership.It forces us to be more creative in terms of how we make those goals.
But the message is not just in the metric.
We consistently return as much value to members as any credit union in the country, Winne says. That happens because we forego a lot of opportunities to make additional money while building relationships and providing membersa great deal of value. All while we manage the risk.
Read The Whole Story
RETURN TO INDUSTRY PERFORMANCE BY THE NUMBERS 1Q 2017