Mergers occur in the credit union industry for a number of reasons, the largest proportion being the result of an institution that is currently unable or soon will be unable to shoulder the growing cost of operations. If recent history is any indicator, mergers in the credit union industry are not going away. In fact, they might become more prevalent as innovation and change favor size and scale.
Source: Peer-to-Peer Analytics by Callahan & Associates
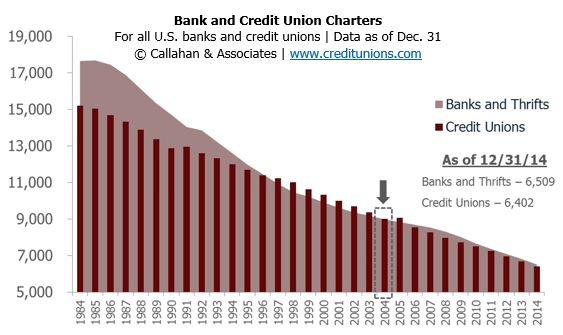
Since 2004, the decline in charters has been similar at credit unions and banks. In the past decade, an average of 250 institutions have merged every year. As competition increases and credit unions broaden their product and member service offerings, the rate of mergers will likely continue at this pace.
Source: Peer-to-Peer Analytics by Callahan & Associates
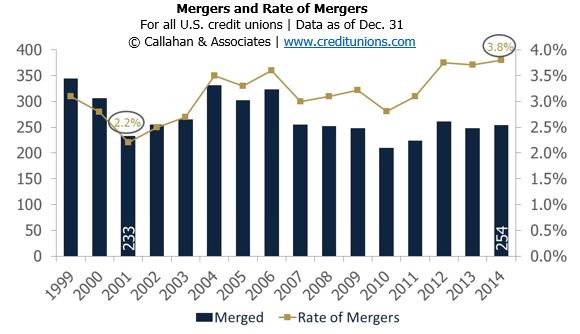
Over the past 15 years, the rate of credit union mergers has ranged from a low of 2.2% to a high of 3.8%. Although the actual number of credit unions merging each year has largely remained constant, the overall decline in the total number of credit unions means the rate of mergers is gradually increasing.
Source: Peer-to-Peer Analytics by Callahan & Associates
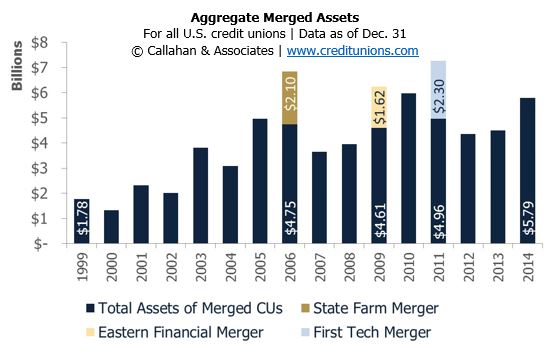
In a normal year, the aggregate assets of merged credit unions has ranged between $4 billion and $5 billion, with the exception of several large mergers that are noted above. The average asset size of merged credit unions peaked in 2009 at $33.8 million. In 2014, the average asset size was $22.8 million, which is in line with recent historical averages.
Source: Peer-to-Peer Analytics by Callahan & Associates
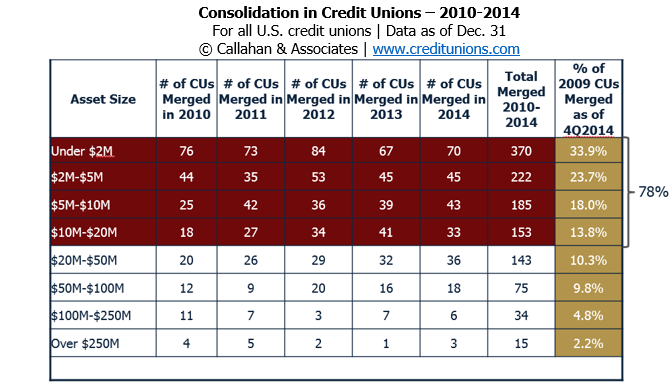
Over the past five years, merged credit unions have been predominantly decreasing in asset size. Of credit unions that have merged since year-end 2009, 78% have had less than $20 million in assets. By contrast, the rate of mergers at institutions with more than $20 million in assets has remained flat over the period. One exception is the $20-$50 million asset class, which posted a slight increase in its merger rate.