One of the most important aspects of asset-liability management is the ability to reprice assets. But are credit unions ready for a rising interest rate environment? These three ratios help illuminate the issue.
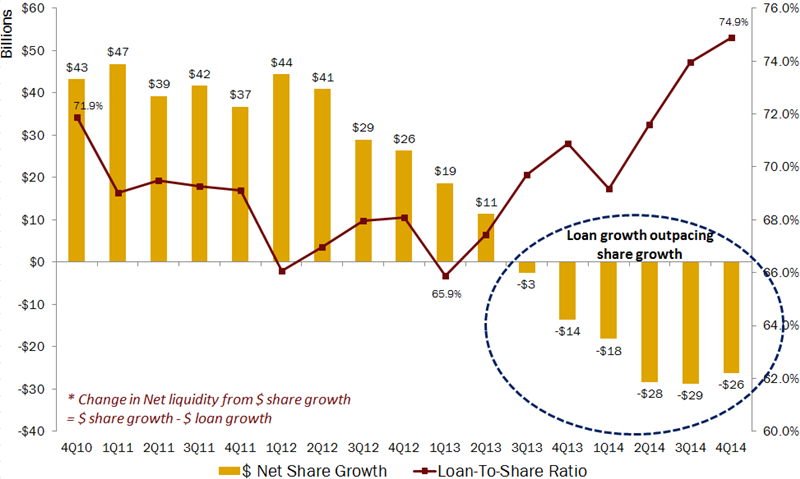
Change In Net Liquidity
For all U.S. credit unions | Data as of Dec. 31*
Callahan & Associates | www.creditunions.com

Shares are the primary funding base for credit union loans. As the U.S. economy started to gain momentum in early 2013, loan demand increased at credit unions and the loan-to-share ratio rose from 65.9% in March 2013 to 74.9% in December 2014. That’s a nearly nine-percentage-point increase. Since third quarter 2013, credit unions have been drawing down on their investments to fund a balance sheet where loan growth is outpacing share growth.
The change in net liquidity shows the dollar amount of difference between annual share growth and annual loan growth. A negative number for this metric does not mean share growth is negative; rather, it means credit unions are converting a portion of their investment balances into loans to meet rising loan demand.
Paydown Rate
For all U.S. credit unions | Data as of Dec. 31*
Callahan & Associates | www.creditunions.com

The paydown rate estimates cash flows from loans in the next 12 months as a percentage of total loans. It indicates whether a credit union will be able to reprice new assets in the next 12 months based on its loan cash flows from the asset side of the balance sheet.
Since the Federal Reserve announced a potential tapering of QE3 in May 2013, the rates have started to rise. The 5-year treasury rate nearly doubled from 0.77% in March 2013 to 1.41% in June 2014. Rising rates and lighter loan refinancing activities pushed down the paydown rate down to 35.1% in 2014. Still, more than one-third of the balances (principals and interest payments) will return to credit unions in 2015, which credit unions can re-lend or reinvest at current potentially higher market rates.
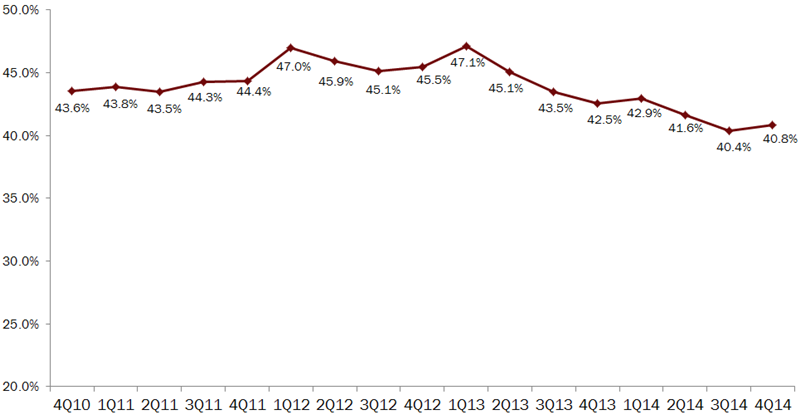
Asset Repricing Opportunity In The Next 12 Months
As A % of Shares And Borrowings
For all U.S. credit unions | Data as of Dec. 31*
Callahan & Associates | www.creditunions.com

The asset repricing ratio measures the entire estimated cash flow readily available that credit union can reprice in the next 12 months if there is unexpected volatility in the funding base. It is calculated by adding the estimated loan cash flows for the next 12 months, plus cash, plus investments maturing in one year or sooner.
At year-end 2014, more than 40% of the industry’s total funding base including cash, short-term investments, and estimated loan cash flows was available for repricing in the next 12 months. This shows that credit unions can respond quickly to rising interest rates and are well-positioned for a changing interest rate environment.
* Source For All Graphs: Callahan & AssociatesPeer-to-Peer Analytics