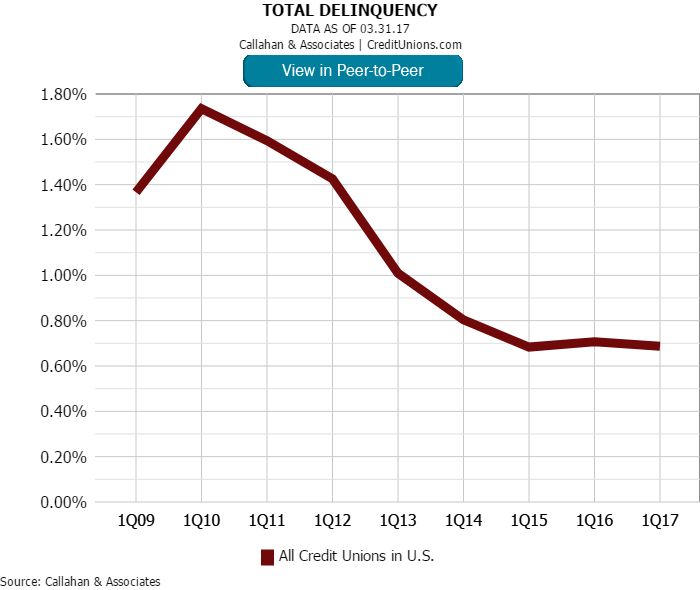
Credit union industry delinquency fell 2 basis points year-over-year since the first quarter of 2016 to 0.69%, approaching its recent low in March 2015 of 0.68%. This has not been because delinquency rates within specific loan products have been steady,however. There are two sides to this story.
Rising delinquency rates in consumer loan products have been offset by decreases in real estate delinquency rates. That’s true within specific regions of the United States and across the country.
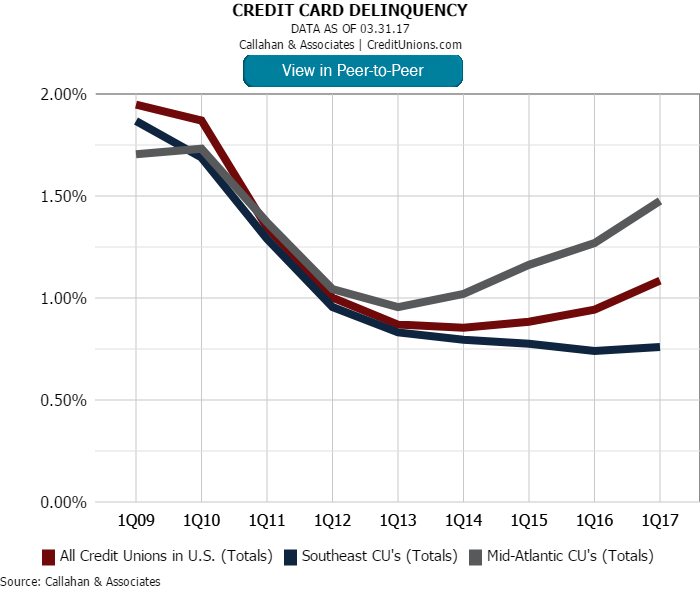
Partly a direct effect of being unsecured, delinquency among credit card accounts was the highest of any product in the loan portfolio as of first quarter 2017, at 1.09%.
Credit card delinquency is up 15 basis points year-over-year. That occurred as credit unions expanded their credit card portfolios by a total of $3.8 billion (7.9%) over the past 12 months. With the broader loan portfolio rapidly expanding, credit cardgrowth has been consistently outpaced by auto (both new and used), first mortgage, and private student loans in recent years.
On the other hand, the dollar amount of delinquent credit card loans increased 23.9%, over two times the growth seen in the total amount of delinquent loans across the entire industry. Additionally, year-over-year credit card net charge-offs increased36 basis points, bringing the national credit card net charge-off rate to 2.56%.
Although credit card delinquency rates in the Southeast NCUA region increased 2 basis points over the last 12 months to 0.76%, they have been the least volatile region since the aftermath of the great recession. The Western region continues to reportthe lowest credit card delinquency rates in the country at 0.72%, but have been on an upward trajectory since 2015, increasing 14 basis points in the last year. The difference in credit card delinquency between Southeastern and Western credit unionshas narrowed from 16 basis points in March 2016 to just 4 today.
How Do You Compare?
The graphs and data in this article were pulled from Callahan’s Peer-to-Peer software. Use it yourself to see how your delinquency stacks up to your credit union peers.
Since 2014, the Mid-Atlantic region has had not only the highest but also the fastest-growing credit card delinquency rate in the country. During this period of just three years, rates have increased nearly 50 basis points to 1.48% as of March 2017. Theexclusion of two major credit unions in this region reduces the Mid-Atlantic credit card delinquency rate to 1.09%; the year-over-year change in delinquency also eases to just 13 basis points over the same period. The omission of these two creditunions also reduces the average national credit card delinquency rate 21 basis points to just 0.88%.
Real estate loans have seen steady decreases in delinquency. After peaking in 2010 at a national average of 2.19%, first mortgage delinquency has gradually declined and now sits at 0.44%. The dollar amount of these loans increased 10.2% year-over-year,adding $33.8 billion to the credit union loan portfolio. Despite this rapid growth, first mortgage delinquency has seen a dollar amount decrease of $355 million (18.0%) since March 2016.
Regionally, the first mortgage asset quality story has been consistent across the country. At 0.63%, Southeastern credit unions report the highest first mortgage delinquency of its peers. Down 31 basis points however, these credit unions have boastedthe best year-over-year improvement of any region. Although writing 8.7% more loans, totaling $64.2 billion as of March 2017, credit unions have seen the dollar amount delinquency in this region drop 27.2% over the period.
Western credit unions showed an improvement of 11 basis points year-over-year to 0.32%, marking the lowest first mortgage delinquency rate of any region for the second year in a row. Over the past 12 months, the Western region has added $10.8 billionto their first mortgage portfolio, a 13.6% increase from March 2016. With the dollar amount of delinquent loans dropping 13.9% in the last year, credit unions in the Western region are demonstrating strong risk management while continuing to achievesignificant balance sheet portfolio growth.


