Callahan & Associates hosted its quarterly Trendwatch webinar on last week, an event which highlighted some of the key trends revealed by second quarter industry data. As expected, the COVID-19 pandemic and subsequent governmental responses have impacted the industry in unprecedented ways. Perhaps surprisingly, second quarter data tells a story of substantial growth across balance sheets, particularly in shares and mortgages. Members need supportive financial institutions, and credit unions have stepped up to meet this demand.
Below are three takeaways from Wednesday’s Trendwatch presentation:
1. Even in a Pandemic, Credit Union Balance Sheets Boomed
Not even COVID-19 can stop industrywide growth. Credit union balance sheets grew at near-record levels in many categories. Industry assets increased by 15.1% annually, led by a 16.5% surge in share balances the fastest growth rate since 2003. Government stimulus programs and unemployment benefits certainly helped catalyze this growth, as many members had extra money on deposit. Share growth is also correlated with slower consumer spending, which has undeniably been affected by the pandemic. Consumer loan originations fell year-over-year, as many people have remained in their homes and cut extraneous expenses from their budgets. However, strong mortgage growth (more on that in a moment) pushed loan balances up 6.6%, on par with recent periods. Together, these balance sheet dynamics caused the industrywide loan-to-share ratio to fall 7.1 percentage points from this time last year to 76.2%, the lowest rate since 2016. This has put to rest some lingering liquidity fears, as investment balances have risen 38.4%, including a 78.6% year-over-year increase in cash & equivalents.
BALANCE SHEET TRENDS
FOR U.S. CREDIT UNIONS | DATA AS OF 06.30.20
Callahan & Associates | CreditUnions.com
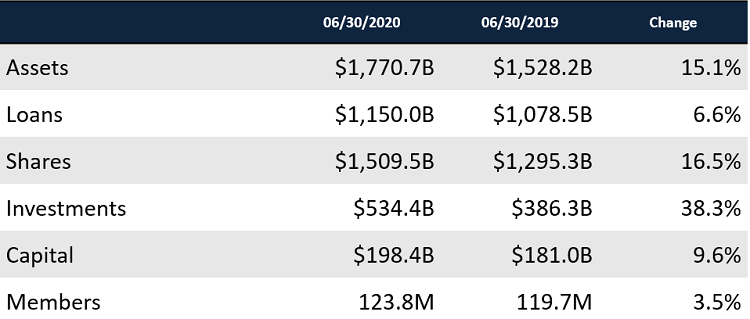
Bottom-line items increased in all major categories, with assets, shares, investments, and capital growth rates all at or near record highs.
2. 2020 is on Pace to be a Record Year for Mortgage Originations
Shortly after the onset of the COVID-19 pandemic, the Federal Reserve cut interest rates to near zero in an effort to stimulate spending. The impact of this monetary policy upon everyday spending is unclear (credit union consumer loan originations are down 0.2% annually, though this does beat some expectations), but Americans have certainly taken advantage of the low rates to purchase or refinance homes. Credit unions have originated $130.0 billion in first mortgages year-to-date, the most on record through the first six months of the year by a wide margin, and 94.2% higher than 2019. According to data from the Mortgage Bankers Association, 63% of first mortgages originated in the second quarter were refinances. Historically, credit unions have performed well in a refi-heavy environment, and this year is no exception as industry market share increased 5 basis points to 8.6%.
FIRST MORTGAGE ORIGINATIONS AND MARKET SHARE
FOR U.S. CREDIT UNIONS | DATA AS OF 06.30.20
Callahan & Associates | CreditUnions.com

Year-to-date mortgage originations are nearly double what they were over the first six months of 2018, the next most productive mortgage origination year on record.
While credit unions have clearly been helping their members purchase and refinance homes, the sudden rate cuts have affected loan spreads. The industry’s net interest margin fell 31 basis points from last year to 2.87%, placing significant pressure on credit union ROA. As a result, many credit unions have decided to sell some of these low interest mortgages off to the secondary markets (Fannie Mae and Freddie Mac). Total mortgages sold increased 121.2% year-over-year faster than total mortgage origination growth.
3. Asset Quality has Improved (on Paper) Since Last Year
Industrywide, delinquency rates have fallen by 5 basis points since June of 2019, to 0.58%. The net charge-off ratio has also fallen since last year, to 0.52%, a 3-basis-point improvement. This is likely due to a combination of short-term government stimulus programs and lenient loan forbearance policies by credit unions in the face of the COVID-19 pandemic. Unless the health crisis improves, we would expect an increase in these metrics in the coming quarters, particularly if stimulus programs are not renewed. Credit unions are clearly planning for this as well, noted by their 21.3% annual increase in allowance for loan & lease losses, which has driven the industry’s coverage ratio up to 172.2%, the highest on record.
ASSET QUALITY: NET CHARGE-OFF RATIO + DELINQUENCY RATIO
FOR U.S. CREDIT UNIONS | DATA AS OF 06.30.20
Callahan & Associates | CreditUnions.com
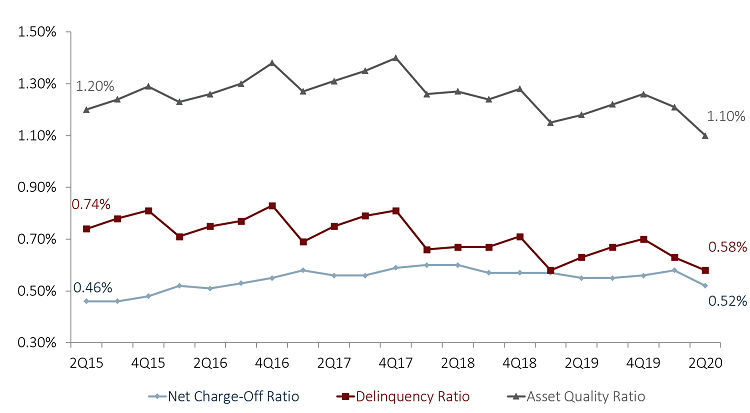
Asset quality nears its best level in recent years, but much of this improvement may be artificial as result of financial institutions deferring late loan payments.
The supportive policies are paying dividends in the form of deepening member engagement. The average member relationship (average loan balance per member + average share balance per member) increased $1,392 since last June to $20,676. Though auto lending has slowed (due to a mix of both COVID-19 lockdowns and strategic changes by credit unions to reduce indirect auto loan programs), market share has increased in both first mortgage and credit card lending. While asset quality issues may prove problematic in the coming quarters, credit unions have positioned themselves well to cover these potential losses and will have fostered significant member support along the way.
Customize A Data Scorecard With 2Q20 Data
2Q20 industry data is here and we want to send you a custom scorecard. Pick 10 ratios most important to your credit union and we’ll compare you to relative credit union and banking peers.
Learn More
![]()