Callahan & Associates hosted its quarterly Trendwatch webinar on Wednesday, providing an overview of third quarter credit union trends for 2019. Of note, loan originations hit a new record high, the loan-to-share ratio falls, and the net interest margin grows.
Here are three takeaways from this must-watch event:
No. 1: Loan Originations Hit Record High
Credit unions generated $151.1 billion in loans in the third quarter, rebounding from the slow start to the year. This figure represents the highest loan origination total on record. Year-to-date, credit unions have originated $399.5 billion in loans, up 2.8% from levels reported through the first nine months of 2018. Most impressively, year-to-date first mortgage originations are up 12.2% year-over-year, reaching a yearly total of nearly $120.0 billion through September 2019.
In the first quarter, credit union mortgage production contracted 15.3% annually. Since then, mortgage lending has rallied as cooperatives nationwide booked $52.9 billion in first mortgage originations in the third quarter alone. This is a 39.9% increase from mortgage originations reported between July and September of 2018. Non-real estate consumer originations continue to lag behind 2018 levels, down 0.9% year-over-year. Year-to-date, credit unions have originated $252.6 billion in non-real estate loans, a slowdown largely attributed to trailing demand for auto loans across the country.
QUARTERLY LOAN ORIGINATIONS
FOR U.S. CREDIT UNIONS | DATA AS OF 09.30.19
Callahan & Associates | CreditUnions.com
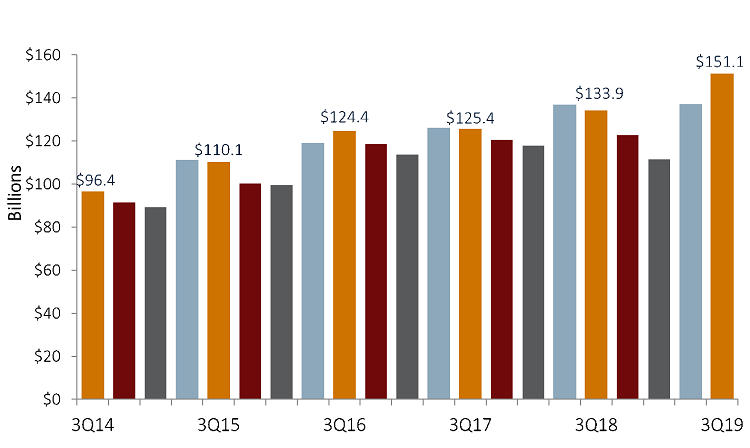
Credit unions originated more in loans in the third quarter of 2019 than in any other quarter on record.
No. 2: Loan-To-Share Falls For The First Time Since 2013
The credit union industry’s loan-to-share ratio is projected to decrease year-over-year for the first time since March 2013, down 78 basis points over the past 12 months to 84.1%, as of September 2019. Credit unions are finding ways to increase liquidity, an area of focus in recent quarters. Share growth is up 2.2 percentage points annually, to 7.1%, as of September 2019. Certificates expanded at the fastest rate of any product, up 22.3% year-over-year, as members take advantage of the lagging deposit repricing following the rising rate environment. As of September 2019, certificate growth accounted for 59.2% of total annual deposit balance growth.
Loan growth at U.S. credit unions is projected to reach 6.1% as of the third quarter, a 3.4 percentage point slowdown from the year prior. Lagging consumer demand for vehicles and the latent effects of a slower start to the year for first mortgage production are largely the cause of this slowdown. Annual auto balance growth is projected to have decelerated 7.2 percentage points over the past 12 months to 3.6%, as of September 2019. Of note, indirect lending growth slowed 10.9 percentage points year-over-year to 4.6%, the lowest reported growth rate since March 2012.
LOAN-TO-SHARE RATIO
FOR U.S. CREDIT UNIONS | DATA AS OF 09.30.19
Callahan & Associates | CreditUnions.com
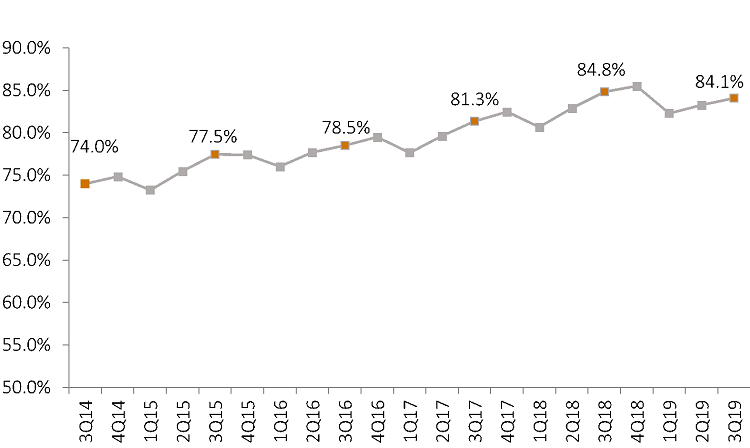
The average loan-to-share ratio, which, prior to this quarter, had increased year-over-year every quarter since March 2013, decreased 78 basis points over the past 12 months.
No. 3: The Net Interest Margin Grows
The net interest margin for the industry improved 7 basis points year-over-year to 3.19% as of the third quarter. The operating expense ratio increased 8 basis points over the same time, reaching 3.20% as of September 2019, exceeding the net interest margin by a single basis point. Five years ago, the operating expense ratio exceeded the net interest margin by 24 basis points. Since then, the net interest margin has increased 34 basis points. Interest income increased 14.8% annually to reach $46.2 billion as credit unions benefit from the growing refinance market. Interest expense also increased, up 44.3% year-over-year to $9.9 billion. This is primarily due to rising funding costs associated with certificate inflows. Year-to-date net income at U.S. credit unions expanded 7.7% over the past 12 months to $11.1 billion as of the third quarter. This jump has pushed the return on assets up 2 basis points, to 0.98%.
NET INTEREST MARGIN VS. OPERATING EXPENSE RATIO
FOR U.S. CREDIT UNIONS | DATA AS OF 09.30.19
Callahan & Associates | CreditUnions.com

The net interest margin improved 7 basis points year-over-year and 34 basis points over the past five. Currently 3.19%, the NII sits just 1 basis point below the operating expense ratio.
How Do You Compare?
These are just three takeaways from Trendwatch 3Q 2019. Go beyond the national averages and dive deeper into individual credit unions, peer groups, and more using Peer-to-Peer. Let us walk you through your numbers with a custom performance scorecard.
Learn More