Callahan & Associates reflected on a tumultuous 12 months during its fourth quarter Trendwatch webinar on Thursday. The credit union company also offered insights into what to look for in 2021.
It should come as no surprise that COVID-19 and the resulting lockdowns was the story of year. However, credit union financial statements and member engagement metrics reveal an industrywide story far from the doom and gloom many might have expected. In fact, by many metrics, 2020 was the movement’s best year on record.
Did you miss the event? Don’t worry. Watch the recording on CreditUnions.com.
Although there is plenty of uncertainty on the horizon, industry data shows cooperatives amplified their purpose-driven values in an effort to help members now and in the future recovery. Here are three takeaways from Thursday’s webinar.
1. 2020 Was A Record Year For Loan Production
Credit unions across the country originated $680.3 billion in new loans in 2020. That’s a 23.5% increase from the year prior and the most granted in a calendar year by more than $100 billion.
The Federal Reserve cut rates to near zero in the beginning of the year, and the first mortgage market flourished as a result. This growth came predominantly in the form of refinances which accounted for 60% of all new first mortgages this year, according to data from the Mortgage Bankers Association a relationship-driven loan type with which credit unions have historically thrived. In dollar terms, mortgage originations grew 62.6% year-over-year to $291.1 billion and comprised 42.8% of loans granted in 2020, a full-year record for the industry.
Growth slowed year-over-year for non-real estate consumer loans; however, there were signs of recovery in the fourth quarter as economies reopened. Still, thanks to a piping-hot real estate pipeline and a resurgent, PPP-loan-fueled commercial loan business that’s up 22.0% year-over-year, credit unions helped nearly 34 million consumers and small businesses finance or refinance borrowings at historically low rates at a time when increasing cash flow was a priority for many.
YEAR-TO-DATE LOAN ORIGINATIONS BY TYPE
FOR U.S. CREDIT UNIONS | DATA AS OF 12.31.20
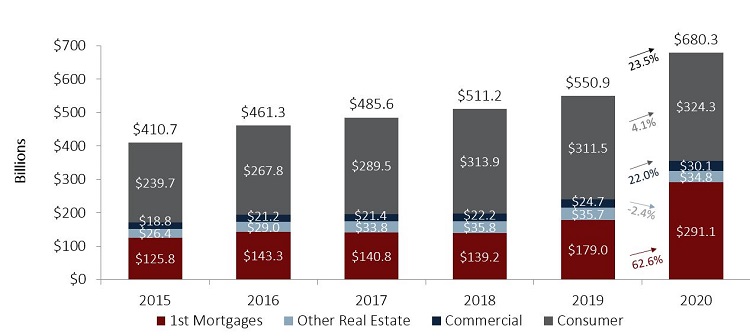
With low rates underpinning a thriving lending market, credit unions have never issued more funds to those in need. Following a mortgage-dominant year, the average balance of a granted loan in 2020 reached a record of $20,022.
Source: Callahan & Associates
2. Share Balance Growth Accelerated, Members Demonstrate Clear Preference For Liquidity
Unemployment reached levels not seen since the Great Depression, but share balances still set a growth record with their 20.4% year-over-year surge. Federal rescue packages, increased unemployment benefits, and the transfer of production to a remote environment within many economic sectors all contributed to this increase. Quarantines, which suppressed day-to-day expenditures, contributed as well.
Despite record high levels of loan originations, loan balance growth slowed year-over-year. That was up only 5.0% annually, versus 6.1% last year, as members directed additional share balances into loan payments. This dynamic, combined with incentives to sell many of the newly booked mortgages to Fannie Mae and Freddie Mac, drove the industry’s collective loan-to-share ratio down to 73.2%, a decline of 10.7 percentage points from year-end 2019.
Credit unions are unsure what to do with this newfound liquidity. Members have demonstrated a clear preference for liquid, core deposit accounts namely, regular shares, drafts, and money markets. Credit unions reported record level growth in all three account types. Share drafts, the most common account for receiving direct deposit government checks, increased 40.7% year-over-year. More than 4 million members opened new checking accounts, reflecting the value consumers see in low-to-no cost deposit accounts, particularly at a time of economic uncertainty.
12-MONTH SHARE CHANGE BY PRODUCT
FOR U.S. CREDIT UNIONS | DATA AS OF 12.31.20
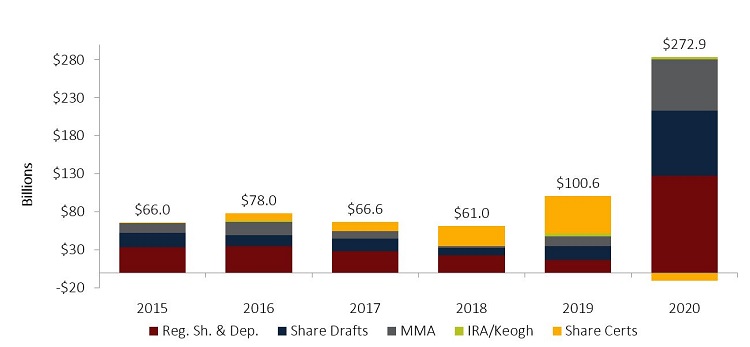
Credit unions added more than $270 billion new shares to their balance sheets this year, nearly triple the previous record for annual change. Of those new shares, more than 100% ($280.5 billion) came in the form of core deposit accounts. That’s because share certificate balances declined (-3.7% or $10.7 billion) for the first time since 2014.
Source: Callahan & Associates
3. Credit Unions Remain Well-Capitalized Despite 17.9% Asset Growth
Credit unions are clearly supplying high-demand products on both sides of the balance sheet, and industry assets are accordingly up 17.9% year-over-year. On the income statement, spread pressures from sudden interest rate cuts drove net interest margins down, forcing credit unions to turn elsewhere namely non-interest income streams to generate the revenue to support their expanding balance sheets.
Overall, credit unions performed well given the challenges presented over the past year. Industrywide return on assets rebounded from a low of 0.52% in June to 0.70% by year-end. Although capitalization ratios fell year-over-year, the industry’s 10.3% net worth ratio and an 11.1% total capital ratio remained strong, indicating credit unions are well-positioned to continue serving members in 2021 and beyond.
NET WORTH & CAPITAL
FOR U.S. CREDIT UNIONS | DATA AS OF 12.31.20
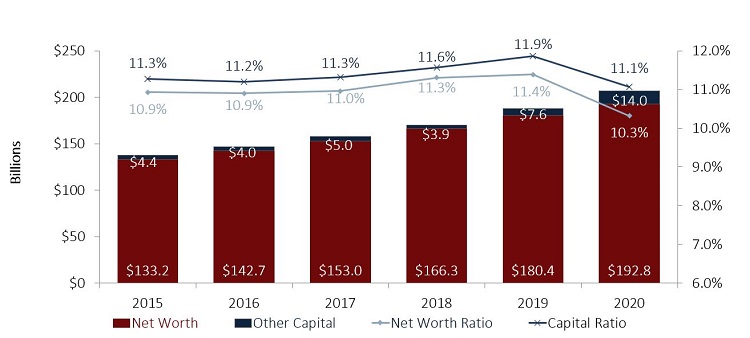
Earnings pressures and rapid asset growth suppressed capital ratios in 2020, but credit unions adapted their earnings models throughout the year to minimize this contraction. With 99.2% of the industry still above the NCUA’s 7% well-capitalized ratio, there is plenty of room to operate.
Source: Callahan & Associates
NET WORTH RATIO DISTRIBUTION BY INDUSTRY ASSETS
FOR U.S. CREDIT UNIONS | DATA AS OF 12.31.20
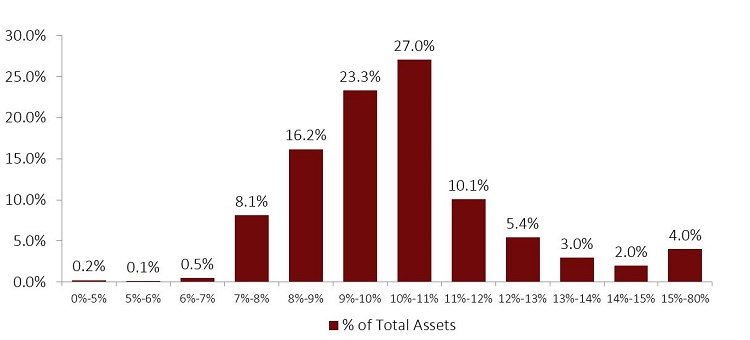
The industry is healthily capitalized. Broken out by asset size, more than 50% of credit union assets are held by credit unions operating in the 9%-11% range for net worth ratio.
Source: Callahan & Associates
Did you miss the event? Don’t worry. Watch the recording on CreditUnions.com.
Custom Data Scorecard For Your Credit Union
If the data and trends we shared in this article piqued your interest request a custom scorecard to see it for your credit union. We’ll compare your organization to national and local credit unions using the key trends and ratios most important to your goals and priorities.
REQUEST NOW