Credit union performance remained strong in the last quarter of 2021. The industry reported growth in members, originations, total loan amounts, ROA, and net worth. Interestingly, commercial and consumer loan originations outshined first mortgages, posing an unusual trend for the industry.
In the mortgage portfolio, rising home prices and decreased sales to the secondary market contributed to an increase in first mortgage loan balances.
Elsewhere, previously overallocated provisions for loan losses are maintaining capitalization ratios; however, credit unions are now spending down that line item.
No.1: Credit Unions Are Attracting New Members And Deepening Relationships
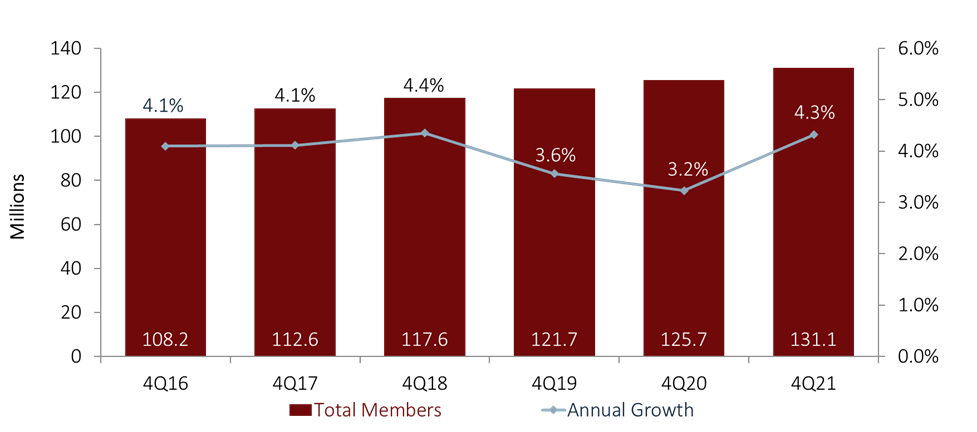
More than 5.4 million Americans joined a credit union in 2021. Total membership at U.S. credit unions grew 4.3% year-over-year to 131.1 million by year-end. The average member relationship increased, too. It rose 5.6% annually to $22,534 ‘ $1,265 higher than one year ago. Share draft penetration a key metric for tracking a consumer’s primary financial institution expanded 1.0 percentage point to a record 61.2%. As of Dec. 31, the industry reported 80.2 million open draft accounts.
MEMBERSHIP AND ANNUAL GROWTH
FOR U.S. CREDIT UNIONS | DATA AS OF 12.31.21
Callahan Associates |
No.2: Consumer Loan Originations Are On Fire
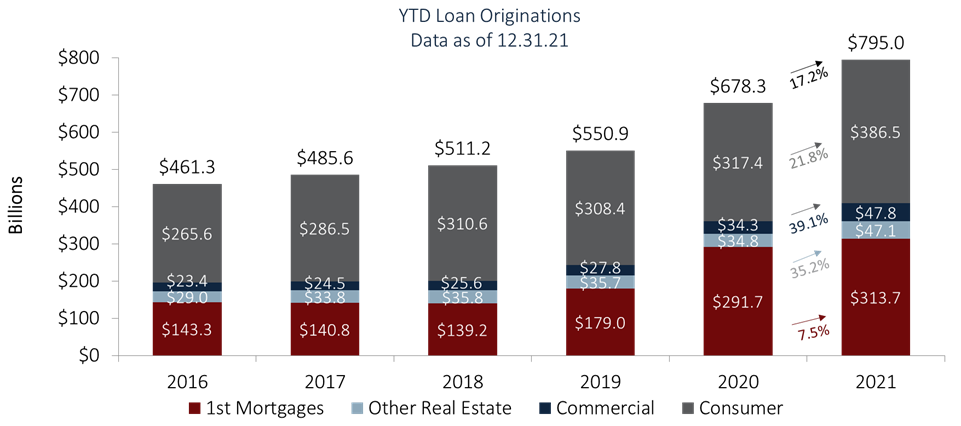
Credit unions originated nearly $800 billion in new loans in 2021 this is up 17.2% from last year’s previous record and is double the industry calendar-year totals from six to seven years ago.
Although first mortgage originations grew a healthy 7.5% year-over-year, it was consumer lending that drove most origination growth in 2021. That segment expanded 21.8% year-over-year and comprised nearly half of all origination dollars for the industry. Other real estate and commercial lending also are helping to diversify the industry’s portfolio. They jumped 35.2% and 39.1%, respectively.
Despite growth in first mortgage origination dollars, the number has dropped year-over-year. It was still higher than the historical average, but the decline indicates the market might be slowing and increasing home prices are a major factor in strong dollar generation.
YTD LOAN ORIGINATIONS
FOR U.S. CREDIT UNIONS | DATA AS OF 12.31.21
Callahan Associates |
No.3: Early Loan Paydowns Are Slowing
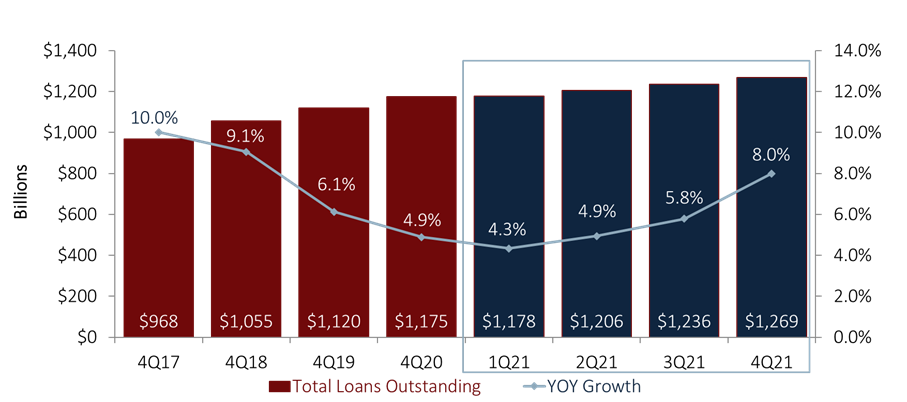
Total loans outstanding grew 8.0% year-over year and hit a new record of $1.2 trillion. This was the fastest annual growth rate for the industry since the onset of the pandemic.
Credit unions have made loans at a record-setting pace for nearly two years but have had a difficult time keeping those loans on the balance sheet. Federal relief packages have allowed members to pay down debt nearly as fast as they took it on; however, these early paydowns have slowed, allowing for record lending to stick around at greater rates.
Mortgages, as always, were a major driver of outstanding loan growth, but auto loans and credit card balances also expanded during the year and quarter. Indirect partnerships and secondary market participations have helped facilitate this growth.
TOTAL LOANS AND ANNUAL GROWTH
FOR U.S. CREDIT UNIONS | DATA AS OF 12.31.21
Callahan Associates |
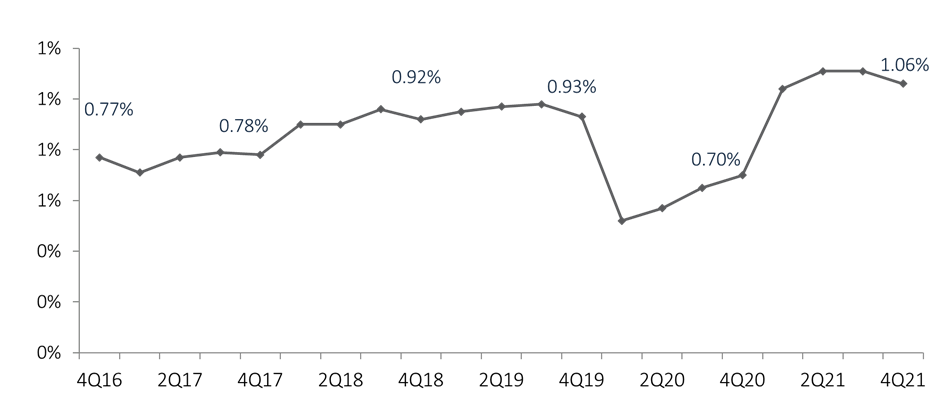
No.4: Increased Earnings Reflects Strong Performance In 2021
A record ROA throughout the year has allowed credit unions to reinvest in capitalization and communities. The industry generated such earnings through interest income via success in keeping loans on balance sheets and expense savings. Asset quality also remained stronger than the historic norm, which has allowed credit unions to reduce their provision expenses.
However, these earnings are not sustainable and should not be in a not-for-profit industry. Provision overallocation in 2020 has allowed credit unions to maintain their capitalization ratios in 2021. However, ballooned allowance accounts will eventually burn off and need to be replenished, and operational expenses will need to increase to support increased asset balances. The slight decline in fourth quarter earnings compared to earlier in the year is a sign this shift has started to occur.
RETURN ON ASSETS
FOR U.S. CREDIT UNIONS | DATA AS OF 12.31.21
Callahan Associates |
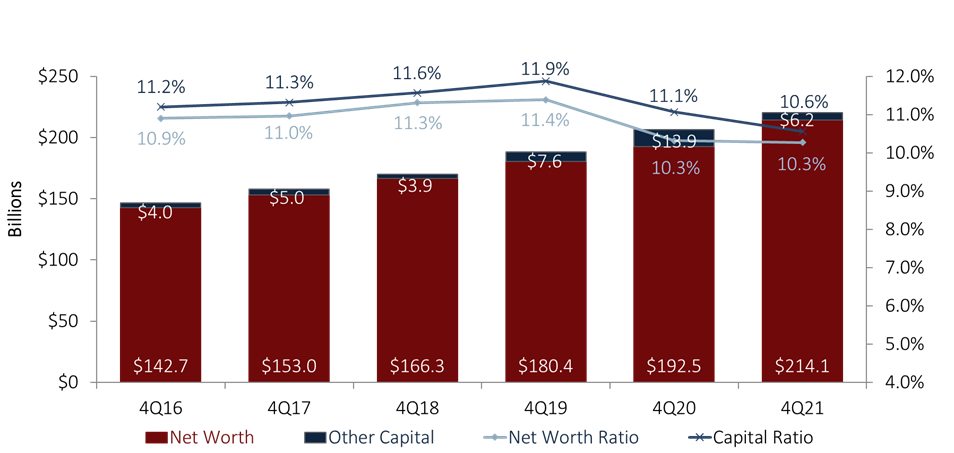
No.5: Historically High Earnings Can Fund Capitalization
Total industry net worth continued to grow; it was up 11.2% to $214.1 billion at the end of 2021. The aggregate credit union net worth ratio remained a healthy 10.3% of assets.
Credit unions have plenty of available capital to bolster operations and member support. Upcoming regulatory capitalization changes from the NCUA, however, pose a potential confounding factor. Many credit unions might opt to hold onto excess capital, at least during the transitionary period between the old and new reporting standards. It will be up to credit union leaders to balance their capital usage effectively across their obligations to both their regulators and their member-owners.
NET WORTH AND OTHER CAPITAL
FOR U.S. CREDIT UNIONS | DATA AS OF 12.31.21
Callahan Associates |