The loan-to-share ratio is an insightful measure of a credit union’s liquidity. Driven by lending volume and deposit acquisition, the ratio represents a balancing act between two sides of the balance sheet.
On the one side, loan growth speaks for credit union operations, such as culture, marketing, and risk management. On the other side, deposit growth speaks to external factors, such as membership demographics. Generally, a higher loan-to-share ratio indicates a credit union is taking on higher risk for a greater profit.
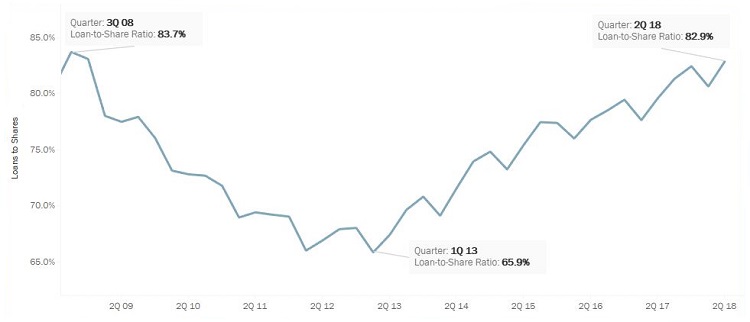
In the second quarter of 2018, U.S. credit unions reported an average loan-to-share ratio of 82.9%. This is the highest rate since Dec. 31, 2008 when it was 83.2% and is 16.1 percentage points higher than when the ratio bottomed out in the third quarter of 2013. Since 2013, loan balances at credit unions have increased 66.8%; deposits, in the meantime, have increased 32.6%.
ContentMiddleAd
LOAN-TO-SHARE RATIO
FOR U.S. CREDIT UNIONS | DATA AS OF 06.30.18
© Callahan & Associates | www.CreditUnions.com
It is important to note that large loan and share balances are not indicative of a higher loan-to-share ratio. For example, credit unions in the NCUA Mid-Atlantic Region reported the highest average loan-to-share ratio 87.4%. Meanwhile, credit unions in the Western Region reported the largest average loan and share balances $16,995 and $6,304, respectively.
Maryland credit unions posted the largest increase in the loan-to-share ratio since June 2015, up 13.6 percentage points in the past three years. During that time frame, loans at Maryland credit unions increased 56.5% while deposits are up 19.1%.
At a state-level, the loan-to-share ratio in the past three years has increased the most, 13.6 percentage points, at Maryland credit unions than at credit unions in any other state. During that time, loans at Maryland credit unions have increased 56.5% and deposits 19.1%.
LOAN-TO-SHARE RATIO BY STATE
DATA AS OF 06.30.18
© Callahan & Associates | www.CreditUnions.com
| State | Loans/Shares (June 2018) | Loans/Shares (June 2015) | Percent Change From 2015 |
|---|---|---|---|
| MD | 82.0% | 67.2% | 14.9% |
| IA | 99.4% | 85.8% | 13.6% |
| MS | 74.5% | 61.0% | 13.5% |
| TN | 89.1% | 77.8% | 11.3% |
| MN | 82.6% | 71.8% | 10.8% |
| GA | 81.5% | 70.9% | 10.6% |
| WY | 89.6% | 79.2% | 10.4% |
| CA | 79.6% | 69.3% | 10.3% |
| CO | 89.2% | 79.2% | 10.1% |
| IL | 78.5% | 68.6% | 9.9% |
Net liquidity change, calculated as the difference between annual change in deposits and annual change in loans, has been negative for the past five quarters. Since the first quarter of 2013, the net liquidity change at credit unions has reached positive territory in only two quarters, third quarter 2017 and first quarter 2017. A negative net liquidity change means the annual change in loans was larger than the annual change in shares, resulting in an increased loan-to-share ratio.
NET LIQUIDITY CHANGE
FOR U.S. CREDIT UNIONS | DATA AS OF 06.30.18
© Callahan & Associates | www.CreditUnions.com

Rising consumer confidence paired with an improving economy both partially account for today’s increasing loan-to-share ratio. Loan products are more popular than deposit products as consumers look to put their money back into the market. Over the past year, only three states and Washington, DC, took in more deposits than loans.
NET LIQUIDITY CHANGE BY STATE
DATA AS OF 06.30.18
© Callahan & Associates | www.CreditUnions.com
| State | Loan Growth | Share Growth | Net Liquidity Change |
|---|---|---|---|
| CA | 11.5% | 5.7% | ($4.8B) |
| IL | 10.8% | 3.2% | ($1.8B) |
| MI | 12.6% | 6.1% | ($1.6B) |
| FL | 10.4% | 5.7% | ($1.2B) |
| WA | 11.1% | 6.5% | ($1.1B) |
| PA | 10.1% | 4.5% | ($1.1B) |
| VA | 10.1% | 8.8% | ($1.1B) |
| WI | 10.9% | 6.5% | ($1.0B) |
| MD | 10.6% | 2.9% | ($1.0B) |
| TX | 7.4% | 5.1% | ($0.9B) |
Loan-to-share ratios are likely to keep increasing throughout the country as the economy continues to expand. However, thoughtful deposit and loan strategies will help credit unions effectively manage reduced liquidity.
Curious how your loan-to-share ratio compares to your peers? Let us walk you through your numbers with a custom performance audit. Sign up now.