Top-Level Takeaways
-
Membership growth increased 35 basis points year-over-year to 4.4%.
-
The average member relationship expanded 3.0% year-over-year.
-
Loan growth outpaced share growth for the 22nd consecutive quarter, and the loan-to-share ratio reached a record 84.8%.
The number of active credit unions continued to decline in the third quarter of 2018, dropping by 45 to 5,551 as of Sept. 30. The industry closed the quarter with 3,421 federal charters and 2,130 state charters. Since 2013, the credit union industry has lost 1,202 credit unions to mergers, liquidations, and purchase and acquisitions.
Despite a dip in institutions, annual membership growth was up 35 basis points year-over-year to 4.4% as of Sept 30. The 4.9 million new members who joined the movement in the past year have brought total membership to 116.8 million.
MEMBERSHIP AND ANNUAL GROWTH
FOR U.S. CREDIT UNIONS | DATA AS OF 09.30.18

Credit union membership increased by 4.9 million in the past year, bringing total membership to 116.8 million as of Sept. 30, 2018.
Source: Callahan & Associates
The credit union movement is nearly 117 million members strong. More importantly, these are engaged members, not empty relationships. The average member relationship was up 3.0% year-over-year to $18,748 as of Sept. 30.
ContentMiddleAd
Notably, the average member relationship continues to increase at a time when membership growth is at record levels, says Jay Johnson, a partner at Callahan & Associates, the Washington, DC based credit union consulting firm. This indicates credit unions are both expanding longer-term relationships and effectively onboarding new members.
AVERAGE MEMBER RELATIONSHIP
FOR U.S. CREDIT UNIONS | DATA AS OF 09.30.18

Both the average loan balance and the average share balance per member have gradually every year for the past five years. They were up, 6.4% and 0.5%, respectively, in the third quarter of 2018.
Source: Callahan & Associates
Along with stronger average member relationships, credit unions have reported improvements from five years ago in credit card, share draft, and auto penetration. A growing membership base runs the risk of diluting penetration metrics; however, that is not currently the case with U.S. credit unions.
Credit unions are clearly finding success deepening relationships while supplying a growing number of products to individual members, evidenced by steadily increasing penetration rates, says Sam Taft, Associate Vice President of Analytics and Business Development.
Mirroring broader economic trends, growth on both sides of the credit union balance sheet slowed down in the third quarter. However, credit union assets did grow 5.6% year-over- year to nearly $1.5 trillion as of Sept. 30.
PRODUCT PENETRATION
FOR U.S. CREDIT UNIONS | DATA AS OF 09.30.18
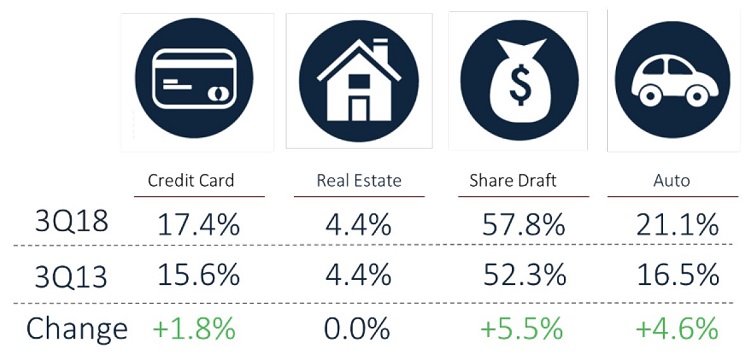
The number of members taking advantage of key products has increased alongside the average member relationship at credit unions.
Source: Callahan & Associates
The average loan balance per member excluding member business loans also increased. It was up 6.4% from $7,867 one year ago to $8,372 as of Sept. 30, 2018. Investment and cash balances declined 5.4% year-over-year as credit unions allowed investments to run-off to fund persistent loan demand.
The aggregate loan balance at credit unions nationwide surpassed $1.0 trillion in the third quarter. The 9.5% annual growth in balances, however, was 25 basis points slower than in the second quarter of 2018 and 103 basis points slower than in the third quarter of 2017.
Deposit growth also decelerated 1.7 percentage points year-over-year to 5.0% however, total share balances still surpassed $1.2 trillion in the third quarter. The average deposit balance per member increased 0.5% year-over-year to $10,376.
It is notable that loan growth has surpassed share growth for 22 consecutive quarters. As such, the loan-to-share ratio is on the rise and was up 3.5 percentage points in the past year to 84.8% in the third quarter. Credit unions have now surpassed the previous high of 83.1% at year-end 2008.
INDUSTRY OVERVIEW
FOR U.S. CREDIT UNIONS | DATA AS OF 09.30.18
© Callahan & Associates | www.creditunions.com
| Data As Of 09.30.18 | 12-Month Growth (3Q18) | 12-Month Growth (3Q17) | |
|---|---|---|---|
| Assets | $1.5T | 5.6% | 6.7% |
| Loans | $1.0B | 9.5% | 10.5% |
| Shares | $1.2T | 5.0% | 6.7% |
| Investments | $352.6B | -5.4% | -2.2% |
| Capital | $166.2B | 6.4% | 6.4% |
| Members | 116.8M | 4.4% | 4.0% |
Growth slowed on both sides of the credit union balance sheet in the third quarter. Investments and cash balances continued to roll off as credit unions look for liquidity to fund loans.
Wait, There’s More!
This is just one section of the industry trends discussion that appears in Credit Union Strategy & Performance. Read the whole discussion today.
