Top-Level Takeaways
-
Membership at U.S. credit unions increased 4.4% year-over-year, pushing the industry to 117.5 million members
-
Share draft penetration, a common measure for determining the percentage of members who use the credit union as their primary financial institution, reached 57.8% in the fourth quarter of 2018.
-
The average member relationship increased $542 in 2018.
2018 was a great year for credit unions nationwide. On the back of a strong economy, with GDP up 2.8% over the year and unemployment levels at record lows, credit unions strengthened member relationships and expanded their balance sheets. In the current climate, cooperatives are reporting notable gains in income and loans but are increasingly facing liquidity pressures. Read on to dive into credit unions performance at the end of 2018.
Membership
Annual membership growth remained a cornerstone of credit union success in 2018. During the year, 5.1 million people joined a credit union and industry membership hit 117.5 million by Dec. 31. Annual membership growth increased 26 basis points year-over-year to 4.4% as of Dec. 31, 2018. In fact, year-end growth has been faster every year since 2010 as more people choose a member-focused, not-for-profit financial services provider.
MEMBERSHIP AND ANNUAL GROWTH
FOR U.S. CREDIT UNIONS | DATA AS OF 12.31.18
© Callahan & Associates | CreditUnions.com
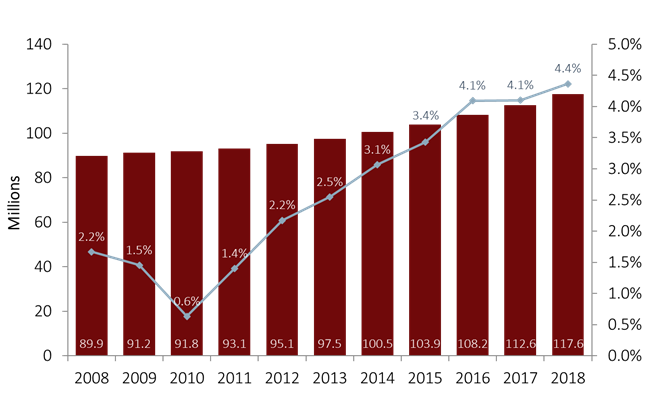
Credit union membership increased 4.4% in 2018 to 117.6 million as of Dec. 31. That’s 26 basis points faster than credit unions recorded in 2017.
The influx of members, however, has not diluted the ability of credit unions to cross-sell products. Penetration rates were up year-over-year across the board. Share draft penetration, often used as a proxy for the percentage of members who use the credit union as their primary financial institution, increased 59 basis points in 2018 to 57.8% as of Dec. 31.
In addition to deposits, members also expanded their relationship through loan offerings. Auto (21.2%), real estate (4.5%), and credit card (17.6%) penetration rates all increased in tandem with membership growth, and year-over-year were up 74, 2, and 11 basis points, respectively. Today, credit unions finance more than one in five auto loans nationwide. Auto lending continues to be the bread and butter of credit union lending, with 21.2% of members holding an auto loan with their credit union as of Dec. 31, 2018.
PRODUCT PENETRATION RATES
FOR U.S. CREDIT UNIONS | DATA AS OF 12.31.18
© Callahan & Associates | CreditUnions.com
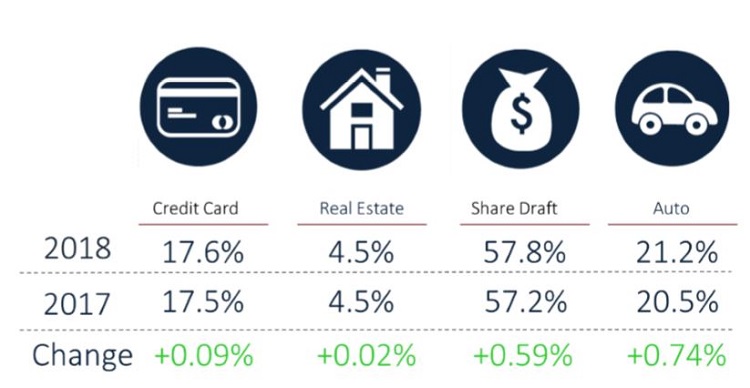
Penetration rates or, the percentage of members who hold these accounts at U.S. credit unions increased annually in all major lending categories plus share drafts.
Member engagement consistently appreciates at yearend, but these gains are a byproduct of both adding members and developing deeper relationships, says Jay Johnson, a partner at Callahan & Associates. In fact, the average member relationship, defined as the average consumer loan and savings balances a member holds at the credit union, was up $542 in 2018 to $18,854.
AVERAGE MEMBER RELATIONSHIP
FOR U.S. CREDIT UNIONS | DATA AS OF 12.31.18
© Callahan & Associates | CreditUnions.com
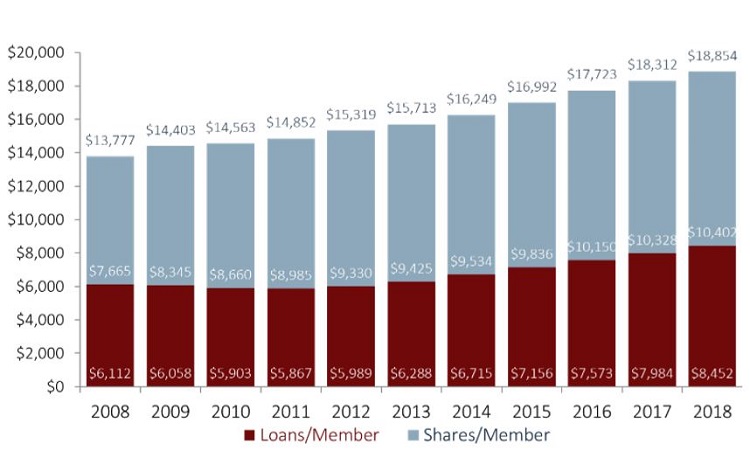
Overall, members are more engaged with their credit unions, which has pushed the average member relationship higher.
Credit unions reported year-end gains in loan and share balances per member. Average loans per member increased from $7,984 in the fourth quarter of 2017 to $8,542 in the fourth quarter of 2018. That’s a 5.9% year-over-year increase. The average share balance held by credit union members hit $10,402 a 0.7% annual gain. This growth dynamic is consistent with broader credit union industry trends, where loan balances are increasing at faster rates than share balances.
Financial Overview
The number of active credit unions continued to trend down in 2018. There were 5,492 credit unions operating at the end of 2018; that’s 197 fewer credit unions than one year ago. The year closed with 3,376 federally chartered and 2,116 state-chartered credit unions. Consolidation through mergers and acquisitions is the leading reason for this decline. Since year-end 2013, 1,121 credit unions have been merged into or acquired by another institution.
Despite a drop in numbers, total credit union assets increased 5.4% in 2018 to $1.5 trillion as of Dec. 31. Investment and cash balances decreased 4.1% annually to $350.6 billion as credit unions increasingly elected to runoff investments to fund loan demand.
Loan balances increased 9.1% year-over-year to nearly $1.1 trillion. Although that growth rate was 97 basis points slower than what credit unions reported in 2017, for the first time ever, credit unions have ended the year with aggregate industry loan balances greater than $1 trillion.
Annual deposit growth also slowed in 2018. It was down 69 basis points year-over-year to 5.3%. Total share balances surpassed $1.2 trillion in 2018 and have been higher than $1 trillion at year-end since 2015. Still, loan growth has outpaced share growth for the past 23 quarters, and the 85.5% loan to-share ratio recorded in the fourth quarter is the highest on record.
INDUSTRY OVERVIEW
FOR U.S. CREDIT UNIONS | DATA AS OF 12.31.18
© Callahan & Associates | CreditUnions.com
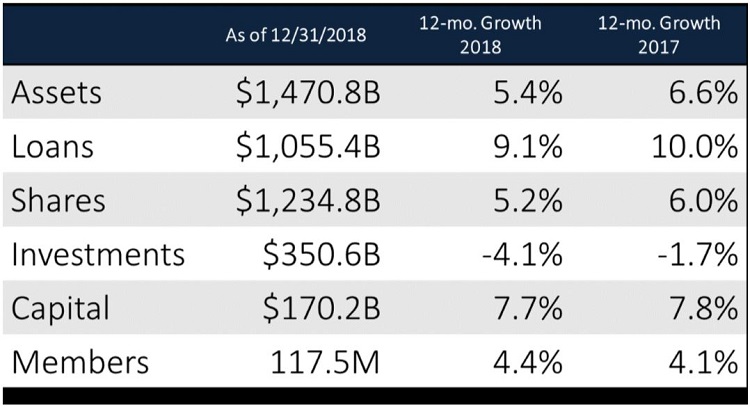
Membership growth has accelerated as more consumers embrace the credit union model. However, annual growth on both sides of the balance sheet has slowed.
Wait, There’s More!
This is just one section of the industry trends discussion that appears in Credit Union Strategy & Performance. Read the whole discussion today.