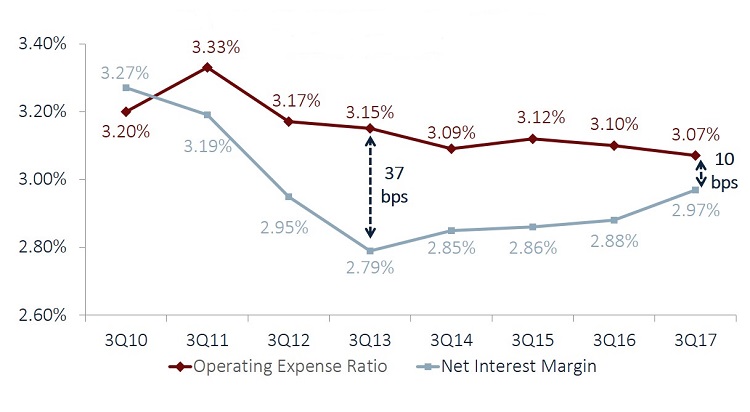
Credit union’s net interest margin reached 2.97% in third quarter 2017. That’s a 9-basis-point increase over one year ago. Interest income and expenses also increased $3.5 billion and $1.8 billion, respectively, which means credit unions are enjoying more favorable margins.
The net interest margin is calculated as annualized interest income less interest expense as a percentage of average assets.
The operating expense ratio dropped 3 basis points year-over-year to 3.07%, marking the second year in a row of third quarter improvement. Operating expenses increased 6.1%, or $2.4 billion, annually. However, assets grew at a faster rate 7.1%, or $89.3 billion. Consequently, the operating expense has declined year-over-year. ContentMiddleAd
The 10-basis-point difference between the operating expense ratio and the net interest margin is the tightest it has been since third quarter 2010. The margin has decreased 26 basis points since September 30, 2013.
Because the net interest margin is below the operating expense ratio, credit unions must lean on non-interest income, which has increased 4.6% year-over-year, to remain profitable. Increased NII coupled with a tightening gap between the net interest margin and operating expense ratio means credit unions are generating higher profits.
NET INTEREST MARGIN VS. OPERATING EXPENSE RATIO
FOR U.S. CREDIT UNIONS | DATA AS OF 09.30.17

Source: Callahan & Associates.
Loans, cost of funds, and investments have all returned differing yields. Yield on loans has declined 3 basis points since third quarter 2016. It is now at 4.54%. Yield on investments, however, has increased 29 basis points year-over-year and will hit 1.61% for third quarter 2017. Total investments at credit unions dropped $9.6 billion annually. Despite the dip, the current rate environment has underpinned a $741.1 million increase in income from investments.
Stay on top of industry trends. Build displays, filter data, evaluate performance, and more with Callahan’s Peer-to-Peer analytics.
The cost of funds ratio at credit unions remained relatively flat. It was up 4 basis points annually to 0.62% as of third quarter. Total cost of funds the sum of dividends on shares and interest on deposits increased roughly 11.5% year-over-year. This outpaced the 7.1% growth of adjusted shares.
CREDIT UNION YIELD ANALYSIS
FOR U.S. CREDIT UNIONS | DATA AS OF 09.30.17

Source: Callahan & Associates.
Catch Up On 3Q 2017 Trendwatch
This must-attend quarterly event for credit union leaders covers performance trends, industry success stories, and areas of opportunity. Attendees will find insight they won’t find anywhere else weeks before the official NCUA data release.
