Credit unions reported year-over-year share balance growth of 14.4% as of Sept. 30, 2021, evidence that members continue to deposit funds into share accounts at a pace higher than historical norms. Still, share growth has slowed somewhat from the record pace throughout the pandemic. Industry deposits grew 2.0% quarter-over-quarter, the second-slowest rate since COVID-19 quarantines began in early 2020.
Members were content to keep saving money in the midst of Delta variant case surges, but slowdowns in pandemic-era Federal relief programs reduced the total amount of funds available to deposit. It appears the latest wave of COVID cases peaked in late August and consumer spending is strong; however, the prospect of additional Federal money through congressional infrastructure bills clouds the outlook for depository institutions.
Some economists expected the Federal Reserve to announce at the September Federal Open Market Committee (FOMC) meeting that it would taper asset purchases to combat inflationary pressures; however, that decision did not come until the early November meeting. Fed chair Jerome Powell’s remarks that Treasury and MBS purchases will end by mid-2022 implies the tapering will be more aggressive than previously anticipated, as CPI numbers continue to be higher than expected levels. Still, Federal Funds rate projections show differing opinions especially for 2023 and 2024 with the range between the high and low forecasted rate set at 150 bps for 2023 and 200 bps for 2024.
Forecasts can and will change quickly, as it was not long ago that economists didn’t expect a rate hike until 2023. No one is sure what things will look like from a macroeconomic standpoint over the next few years, but inflationary pressures seem to be pushing toward more hawkish monetary policy.
Investments Increase $6 Billion
Total credit union investments increased 0.9%, or $6.3 billion, from July 1 to Sept. 30 and ended the third quarter at $707.4 billion. This small increase is a rebound from last quarter’s 0.3% drop, which snapped a six-quarter pandemic-spanning streak of increasing investment balances.
Cash balances fell 1.1% from June 30. This was the second straight quarter of decline after dramatic increases throughout 2020 and early 2021. Credit unions put this cash to work both through accelerating consumer lending channels and by increasing investments in securities and certificates. These higher-yielding investment balances increased 2.2% during the third quarter.
Net liquidity increased in the third quarter as share balances expanded more than loan balances in dollar terms. Loans grew by $30.3 billion quarter-over-quarter, led by first mortgage and auto increases of 3.1% and 2.4%, respectively.
First mortgages have driven loan growth for the past 18 months following record purchase and refinance originations, but plummeting loan-to-share ratios are starting to put pressure on credit unions to hold more of these real estate loans on balance sheets over selling them to secondary markets. First mortgage lending has overshadowed auto lending; however, the auto business is thriving, particularly in the used vehicle space. Still, credit unions added an even greater $35.0 billion to deposit totals since June, and funneled this liquidity increase into investments.
TOTAL INVESTMENTS AND QUARTERLY GROWTH
FOR U.S. CREDIT UNIONS | DATA AS OF 09.30.21
Callahan & Associates | CreditUnions.com
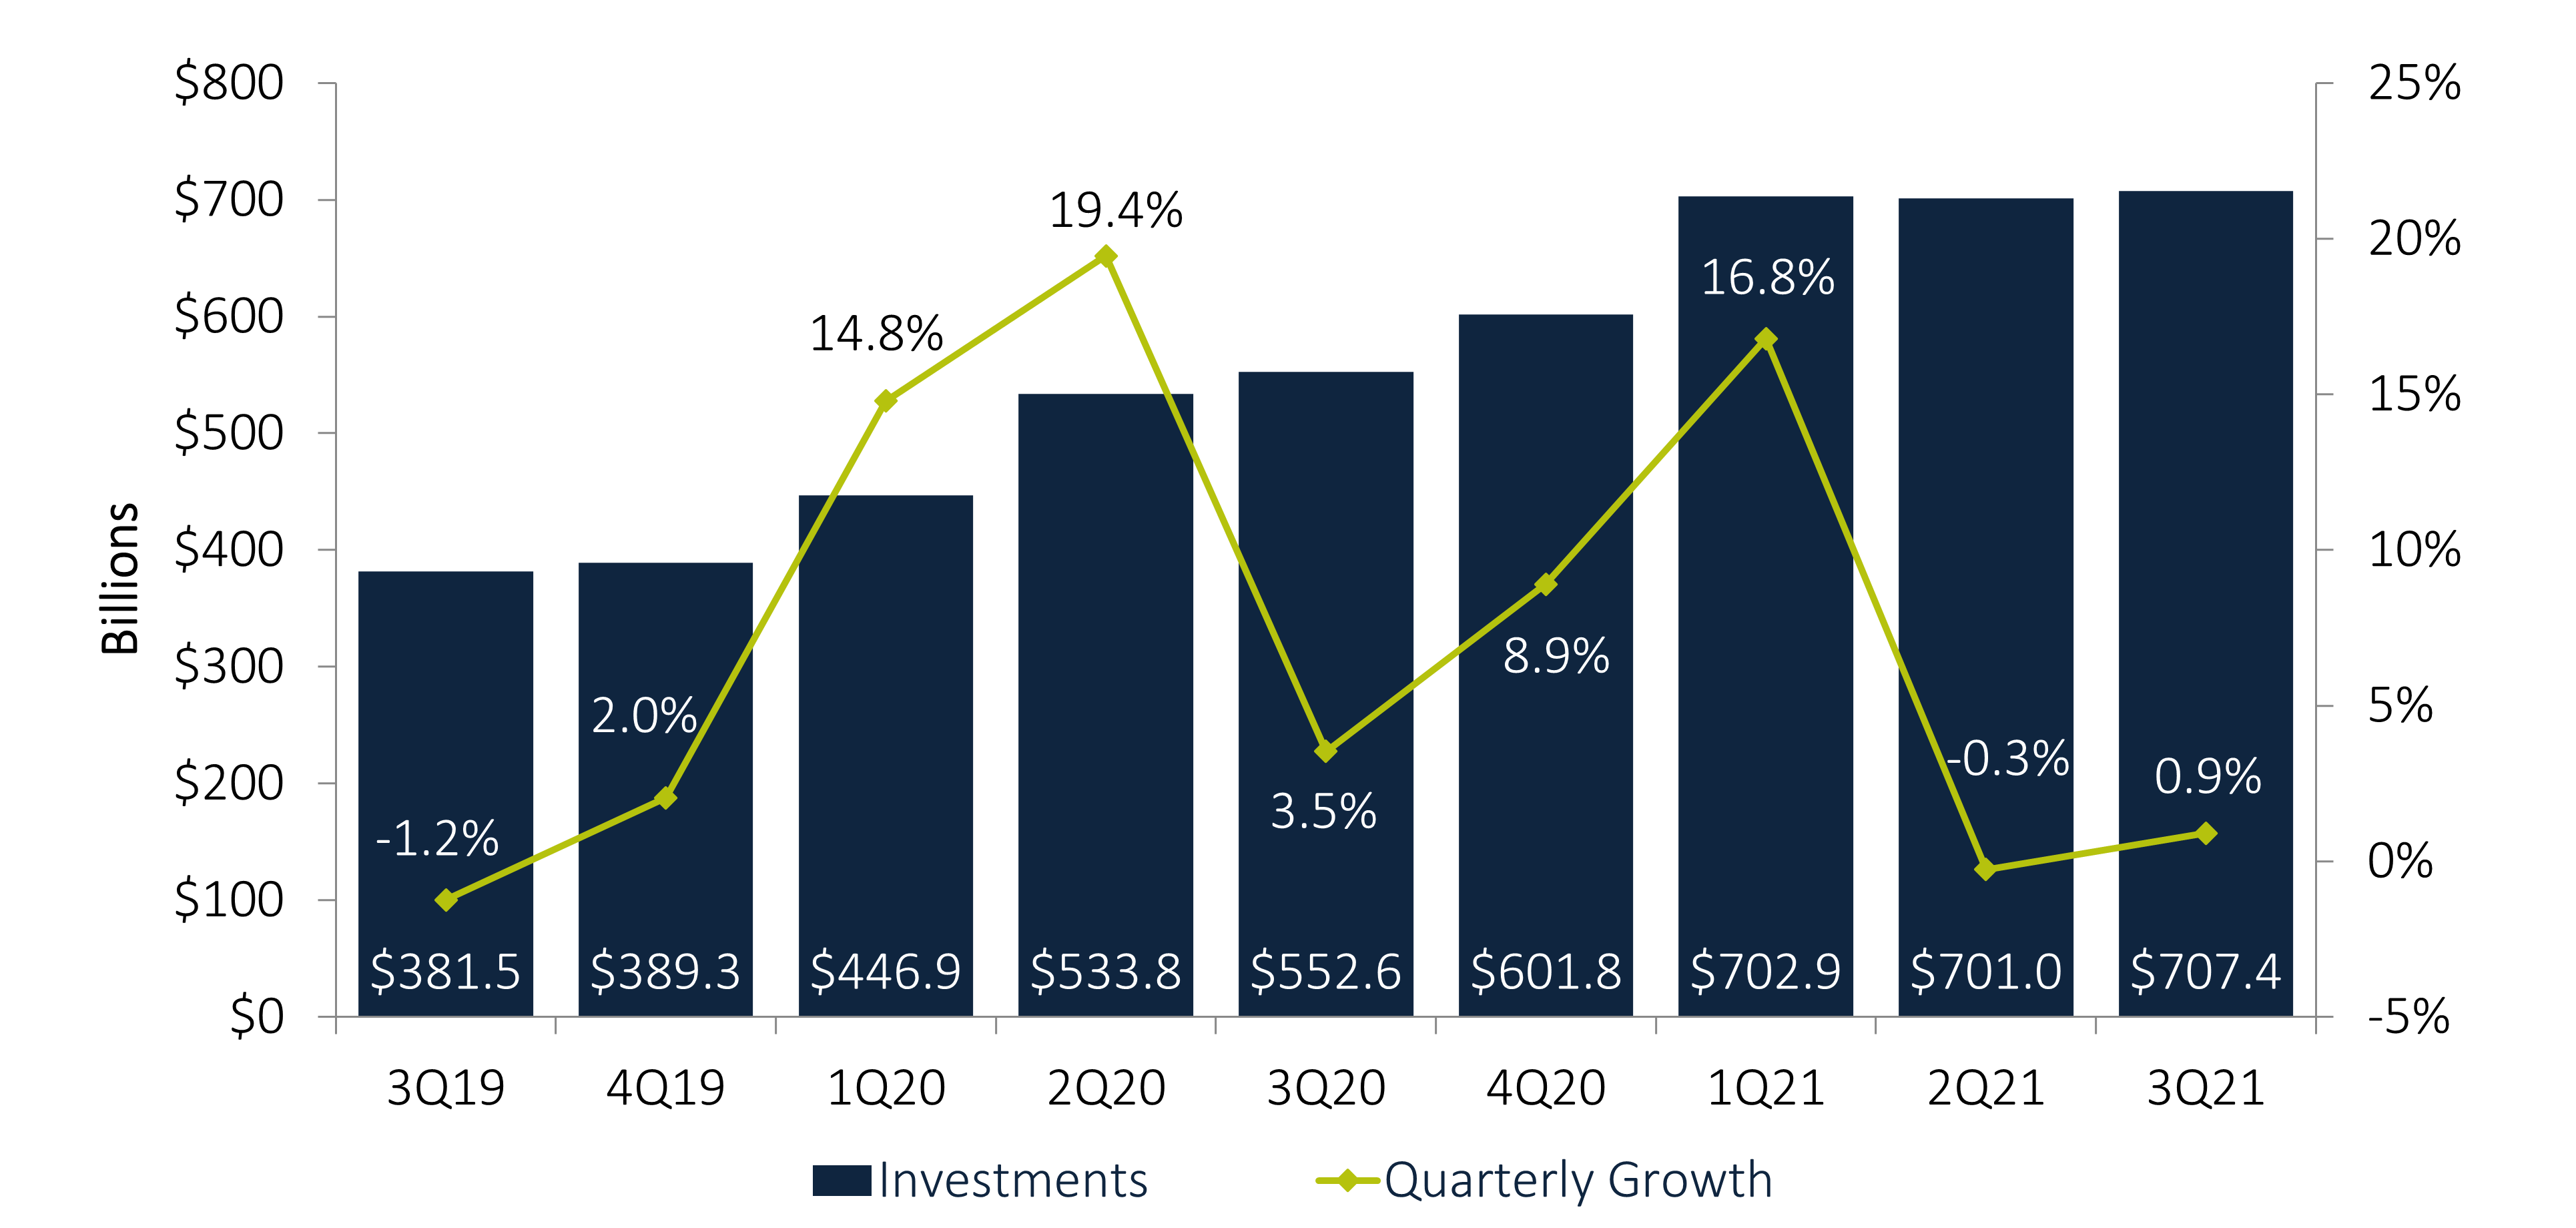
Credit union investment balance growth has slowed since last year’s record pace. Federal relief programs slowed, reducing share inflows and early loan paydowns. This allowed credit unions to hold a greater portion of new assets as loan balances, with suppressed investment growth.
Fixed income yields steepened after the FOMC’s September meeting, as prices adjusted to inflation fears and the prospect of the Fed tapering asset purchases. Yields in the two-to-five-year maturity range increased significantly after hawkish guidance from the Fed. Longer-term yields increased with less severity the 10-year increased 17 basis points in September to end the third quarter at 1.49%, 25 basis points off this year’s high. The steepening yield curve reversed some of the flattening that took place the previous quarter as markets adjusted to hawkish sentiment from central banks.
Adjusted Investment Portfolios Take Advantage Of A Changing Yield Curve
Portfolio managers swapped cash and long-term securities for medium-term securities, resulting in a minimal lengthening in the overall industry investment portfolio. The largest increase came in the three-to-five-year category. This segment increased 11.1%, or $12.0 billion, quarter-over-quarter. This was the second straight quarter of massive inflows to this category in the second quarter it increased more than $18.5 billion. The combined $30.3 billion into the three-to-five-year segment during the past two quarters was the primary driver of investment growth and made up for the decreases in other categories, particularly in short-term securities.
Short- and long-term maturity investment balances, however, fell across the third quarter. Cash and securities maturing in less than a year decreased 1.1% and 3.9%, respectively. Balances of maturities in the five-to-10 year and more than 10 years segments also fell on a quarterly basis 3.1% and 4.2%, respectively as credit unions concentrated their money toward the middle of the curve.
INVESTMENT COMPOSITION BY MATURITY
FOR U.S. CREDIT UNIONS | DATA AS OF 09.30.21
Callahan & Associates | CreditUnions.com
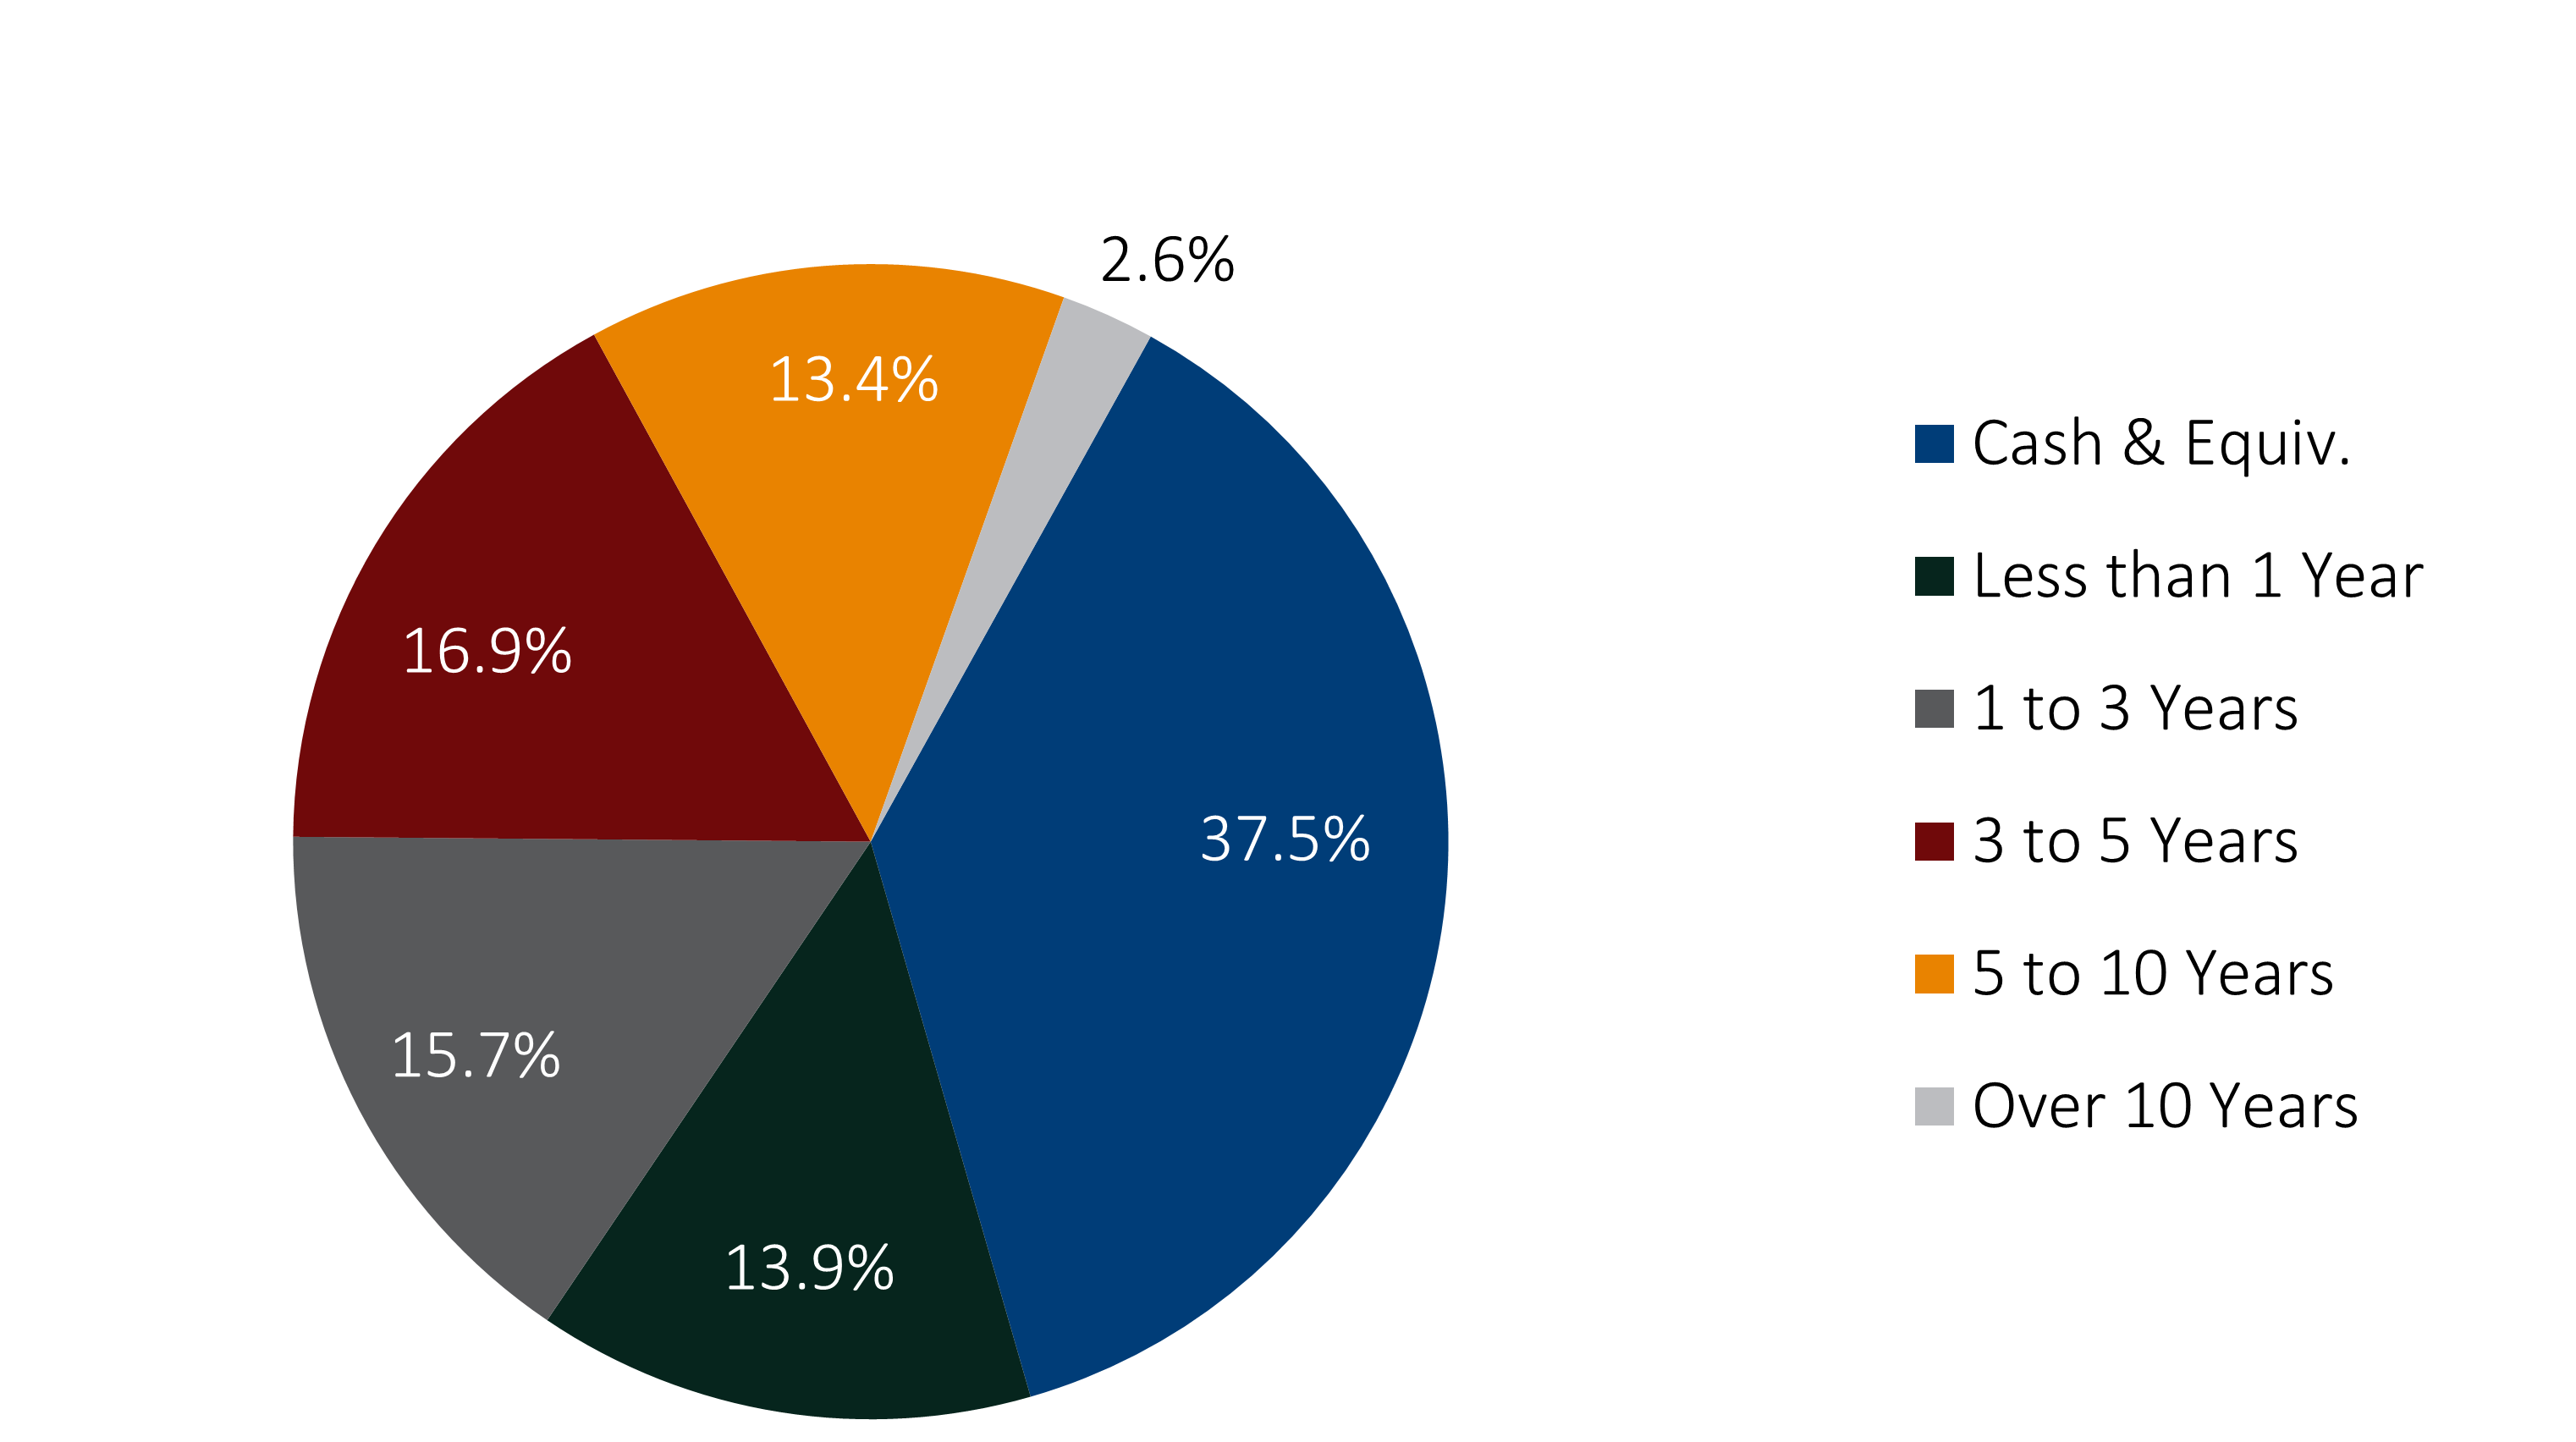
Portfolio managers swapped cash and long-term securities for medium-term securities across the third quarter.
The weighted average life of credit union investments was up to 2.33 years from 2.31 years as of June 30. After the trough in the second quarter of 2020, the life of the industry portfolio has steadily extended due to a shift toward longer term securities.
WEIGHTED AVERAGE LIFE
FOR U.S. CREDIT UNIONS | DATA AS OF 09.30.21
Callahan & Associates | CreditUnions.com
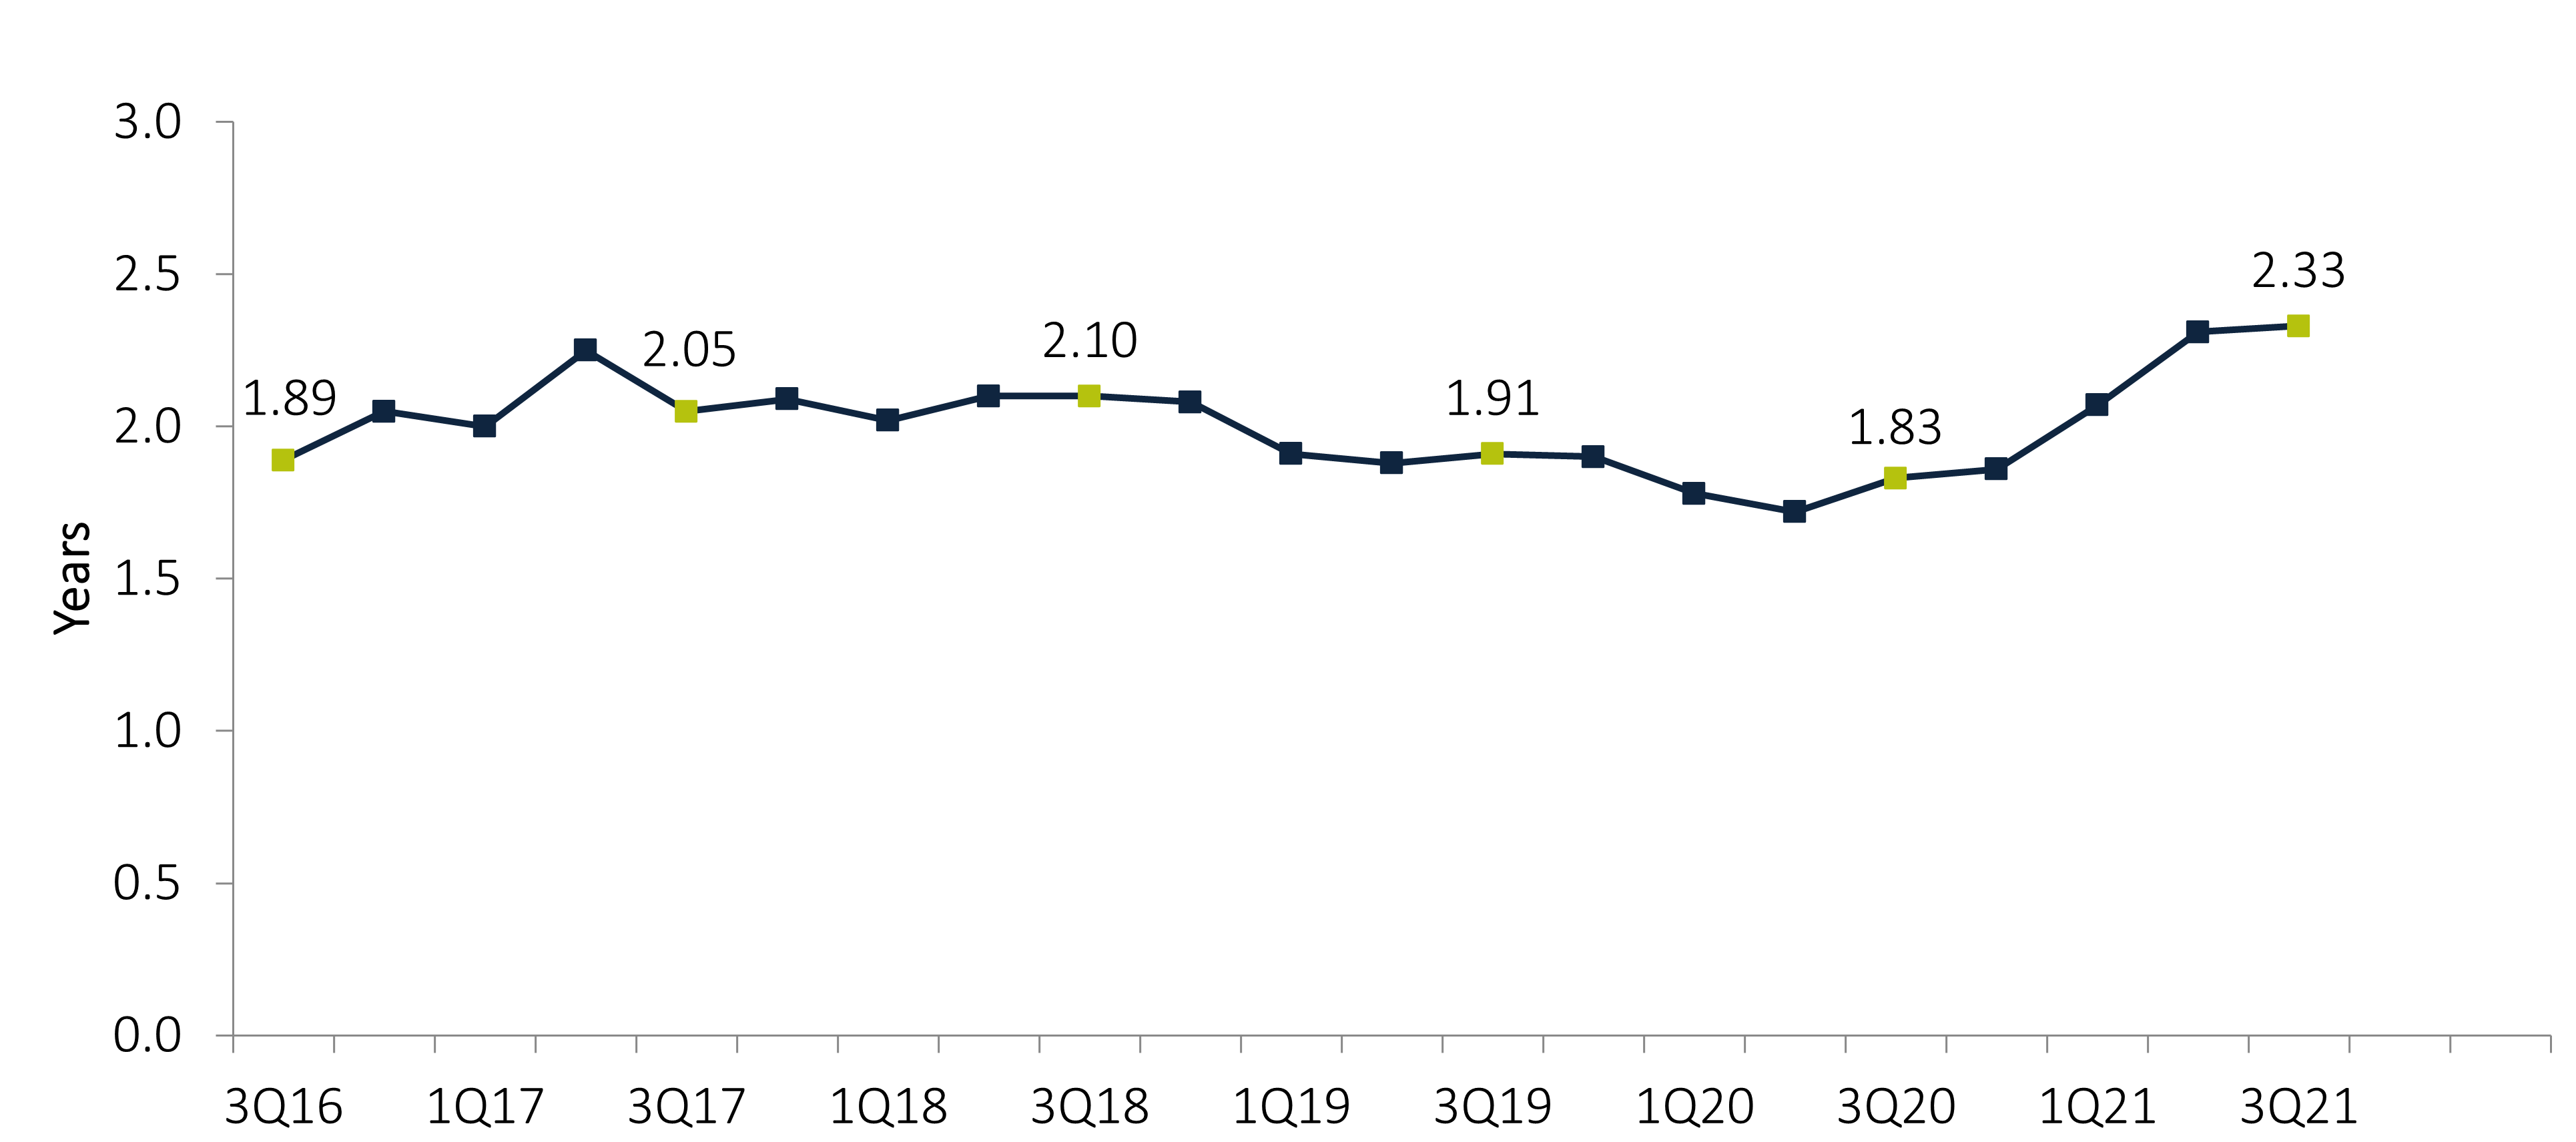
After the trough in the second quarter of 2020, the life of the industry portfolio has steadily extended due to a shift away from cash investments and toward longer term securities.
The decline in cash and 11.1% quarterly increase in securities with three-to-five-year maturities extended the average life in the third quarter. Although balances of securities invested on the long end more than five years of the yield curve have experienced a net outflow, these securities make up a relatively small portion of credit union balance sheets, and their impact was overwhelmed by the shift from cash to mid-curve terms.
About Trust For Credit Unions
Trust for Credit Unions (TCU) helps credit unions succeed in serving their members by providing a professionally managed family of mutual funds exclusive to credit unions as well as the information and analysis they need to support investment decisions. Created by some of the leading credit unions with oversight by a board of trustees, TCU’s mutual fund options allow credit unions to meet their short duration needs, are professionally managed, and are based on the cooperative values of credit unions.
Visit www.trustcu.com or call us at 800-237-5678 to learn more.
The Trust for Credit Unions (TCU) is a family of institutional mutual funds offered exclusively to credit unions. Callahan Financial Services is a wholly-owned subsidiary of Callahan & Associates and is the distributor of the TCU mutual funds. ALM First Financial Advisors LLC is the investment advisor of TCU mutual funds. To obtain a prospectus which contains detailed fund information including investment policies, risk considerations, charges and expenses, call Callahan Financial Services, Inc. at 800-CFS- 5678. Please read the prospectus carefully before investing or sending money. Units of the Trust portfolios are not endorsed by, insured by, obligations of, or otherwise supported by the U.S. Government, the NCUSIF, the NCUA or any other governmental agency. An investment in the portfolios involves risk including possible loss of principal.
If you would like to compare your own institution to the industry benchmark or a specific peer group, please contact TCU at 800-237-5678 or TCUgroup@callahan.com.