This is part of the Callahan Financial Performance Series. Presented by the analysts at Callahan & Associates, the series helps leaders interpret data to drive smarter decisions and uncover new approaches to measure performance.
Callahan clients can access the full version of this article right now on the client portal. Read it today.
The difference between a credit union with $50 million, $500 million, or $5 billion in assets goes beyond dollars and cents. Asset size can shape how efficiently credit unions operate, how they lend, and ultimately how they serve their members. In an industry where the largest institutions hold a disproportionately large share of assets, looking only at overall averages risks masking how mid‑sized and smaller institutions perform.
For a more nuanced look at performance, look across not only key metrics but asset sizes. Comparing peer groups defined by asset size uncovers patterns and trade‑offs that rarely show up in aggregated industry reports — giving credit union leaders a clearer picture of where institutions at different size levels excel or struggle.
MEMBER GROWTH
FOR U.S. CREDIT UNIONS
SOURCE: CALLAHAN & ASSOCIATES
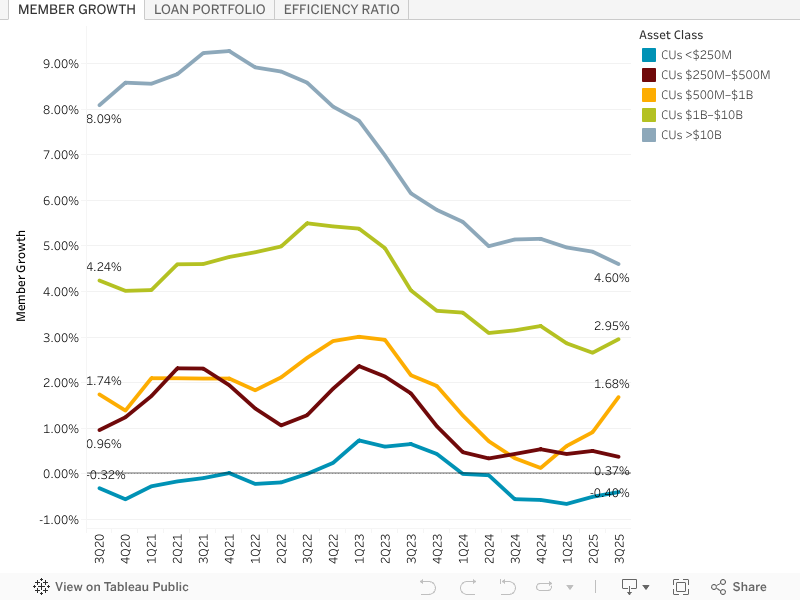
With the ability to leverage scale and resources, larger credit unions consistently attract more members. Smaller institutions — lacking the scale to keep up with digital banking innovations — have fallen behind, and rural communities — where smaller credit unions tend to concentrate — have increasingly lost population to more urban centers. Yet, these defenders of financial health continue to provide crucial product and service offerings tailored specifically to their membership’s needs, emphasizing the vital role they play in their communities.
Book Your Free Performance Analysis Session. Develop a clear picture of your credit union’s performance with a complimentary scorecard from Callahan & Associates. Fueled with your desired KPIs plus a few new ones we might suggest, you’ll be in a better position to benchmark against desired peer groups and share findings with your board. Contact Callahan today.
LOAN PORTFOLIO
FOR U.S. CREDIT UNIONS
SOURCE: CALLAHAN & ASSOCIATES

Examining the loan mix across asset tiers shows how credit unions fulfill the borrowing needs of their members. Smaller institutions carry a higher share of auto and consumer loans; mortgages and other long-term products comprise a smaller piece of the portfolio. As credit unions grow, expanded infrastructure, lending capacity, and product depth allow them to keep more of this activity in-house, increasing the share of mortgages, credit cards, and commercial loans in their portfolios.
Commercial lending peaks in the middle asset tiers where institutional bandwidth and local business relationships meet. It is a perfect snapshot of the credit union ecosystem in motion.
EFFICIENCY RATIO
FOR U.S. CREDIT UNIONS
SOURCE: CALLAHAN & ASSOCIATES
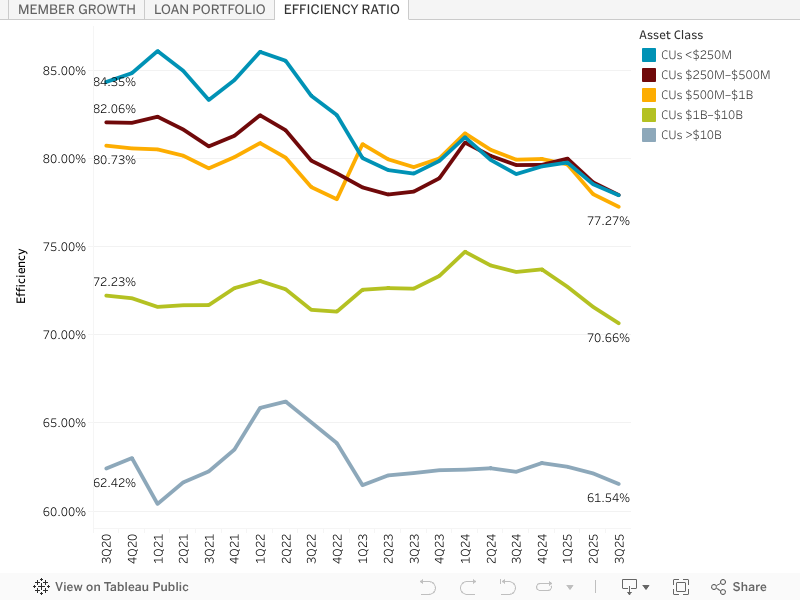
Smaller credit unions carry heavier operational loads because each branch and every employee represents a meaningful share of the total. Larger cooperatives spread their expenses across bigger membership bases and deeper balance sheets, giving them space to operate more efficiently.
Growing institutions are fueling a steady, systemwide march toward lower expense ratios, but that growth does present intangible costs. The branches and employees that make up a meaningful share of total expenses at smaller credit unions also make up a meaningful share of the member experience. Those personal connections can shrink even as fields of membership and institutions expand — it’s a delicate balance credit unions must strike.
Ready To Read The Full Story? Callahan clients may access this exclusive content within the client portal. Read more about these ratios, then dive deeper into lending performance, fee strategies, operating performance, and more. Not yet a client but looking for expert insights to help you adapt to change, develop your organization’s leaders, and stay at the forefront of industry trends? Connect with our team to learn more.