Every year, Callahan & Associates releases the Supplier Market Share Guide: Credit Union Core Processors to offer credit unions different angles of analysis for the core processor market. This year is no different.
There are numerous reasons a credit union might want to survey the market and identify stable, secure partners that have a solid standing in the industry. Whether a credit union’s core system is functionally constrained or has become too costly for the level of service and utility it’s producing, this guide contains all the data leaders need to make an informed decision about this important IT investment.ContentMiddleAd
For the most effective analysis, start with the guide’s market share tables and graphs. This market data provides an overview of performance from both the provider and platform perspective. The tables also offer core rankings based on number of credit union clients, by credit union membership, and by credit union assets.
The Giants
Notable statistics to keep an eye out for include the continued growth of the goliaths in the industry, Fiserv and Symitar.
Symitar widened the gap over Fiserv for the total number of credit union clients served greater than $1 billion in assets. It netted nine $1 billion credit unions year-over-year and increased its margin from two to six institutions. Fiserv added five credit unions with more than $1 billion in assets to its client list.
Although Symitar maintained a competitive advantage with the larger institutions, the reverse is true for credit unions with less than $1 billion in assets. Fiserv continues to dominate all other asset classes, and secured the No. 1 spot for total number of credit union clients served across the industry.
The Rising Star
In terms of gains in market penetration, one core processor had a particularly stellar year: Corelation.
Corelation expanded its credit union client base by a net difference of 14 credit unions representing $9.3 billion in assets annually. This year’s performance helped Corelation achieve a three-year market share change of 0.72%, the second highest of any provider in this guide.
Since its inception in 2009, Corelation has proven attractive to many credit unions. Nearly four years ago, the core provider moved into a larger headquarters to accommodate growth and adapt to increasing client demands.
Corelation is one core provider making waves in the marketplace.
The Platform Players
From a platform perspective, Episys surpassed FedComp to secure the top spot for total number of credit union clients served on a single platform (642) with a margin of 23 credit unions over FedComp (619).
The total number of credit union clients served decreased year-over-year for both Episys and FedComp. The dip for FedComp led to a $23.8 million decline in credit union assets. Episys, on the other hand, increased credit union assets by $37.4 billion. The large variance in assets is partially the result of FedComp’s continued focus on small credit unions.
New For 2018
A new offering for the 2018 Market Share Guide: Credit Union Core Processors is the Platform Profiles. This sponsored section provides an aggregate overview of select providers along with minimum, average, and maximum financial performance metrics for credit unions on the respective cores.
The box-and-whisker plot graph below sources the raw financials from the Platform Profiles to identify the top 10 core providers according to the average annual member growth of client credit unions. It paints a picture of the aggregate average and distribution among credit unions using a specific core processor.
TOP 10 CORE PROVIDERS IN AVERAGE ANNUAL MEMBER GROWTH*
FINANCIAL DATA FOR U.S. CREDIT UNIONS | DATA AS OF 06.30.17
CALLAHAN & ASSOCIATES | CREDITUNIONS.COM
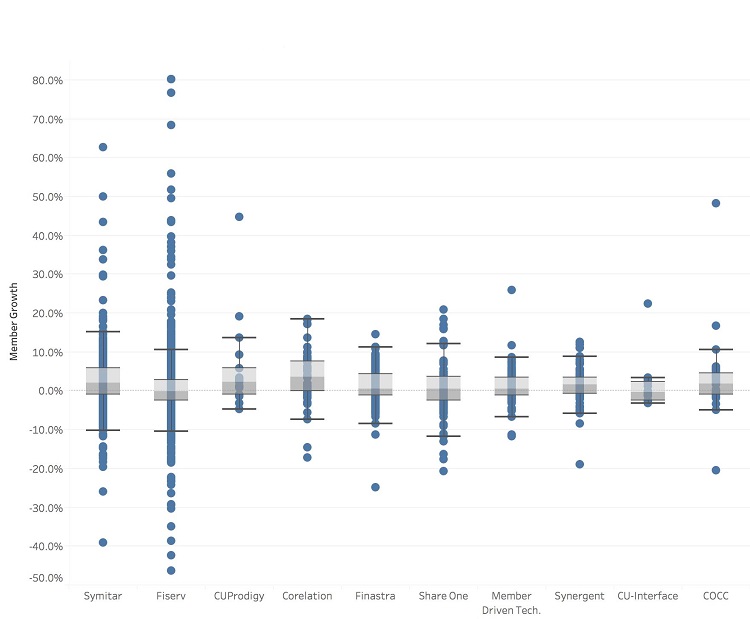
*Average annual member growth as listed in the profile financials section.
An array of factors contribute to member growth at credit unions, and this graph isn’t intended to suggest other credit unions will achieve comparable results with the listed processors. Rather, the graph provides an alternative view of data that underscores the range of performance that exists among the different providers.
Callahan’s 2018 Market Share Guide: Credit Union Core Processors contains numerous statistics meant to capture the interest of credit union leaders and technologists. There are multiple lenses to assess the value a core processor brings to credit unions, and the guide offers a robust base of information to evaluate the market. Decision-makers that keep the credit union’s distinct challenges and strengths top-of-mind will glean valuable information from it.
The 2018 Core Report
Callahan’s Supplier Market Share Guide: Credit Union Core Processors helps leaders fully understand the performance and strengths of core processors in the credit union space. This guide offers:
- Expert opinion and advice.
- Changes in market share.
- Client performance comparisons.
- Aggregate assets for credit union clients.
- Newly acquired clients and integration information for select platforms.
Contact Callahan to order your copy today.